
.svg)


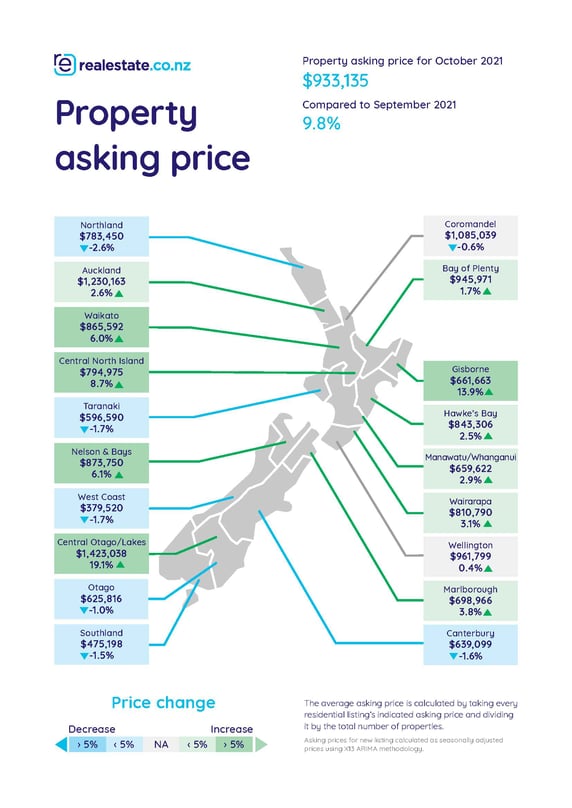
Ten of New Zealand’s 19 regions hit 14-year record-high asking prices in October, according to the latest data from realestate.co.nz—a trend that the property site has seen since COVID-19 reached our shores. Vanessa Williams, spokesperson for the site, says that trends come and go, but it’s difficult to pin down what might slow climbing asking prices.
“Many, of course, wonder what might temper swelling prices, but it’s a complex issue,” said Vanessa. “The market experiences price cycles. From 2007 to about 2012, we reported average asking prices so steady that it nearly got tedious.
“Then, prices accelerated from 2015 – 2017, and slowed again with the introduction of LVRs and the Overseas Investors Act. When COVID-19 reached New Zealand, the property market took off again,” Vanessa continued.
“But really, there are several factors, including low stock, high demand and decades-old legislation that has led the market in this direction. Data from Infometrics and modelling from Statistics New Zealand suggest that we may not get on top of our housing shortfall until 2026. We just haven't built fast enough,” said Vanessa.
Central Otago / Lakes District saw the largest average asking price increase in October—up 41.9% when compared to October 2020, to $1,423,038. The region is still the most expensive area to purchase a property in the country, seeing its average asking price increase by about $200,000 since September—but a handful of lakeside properties hitting the market might be elevating the data.
Other regions showing record high average asking prices included the Central North Island (up 37.2% to $794,975), Wairarapa (up 34.0% to $810,790), Hawke’s Bay (up 28.9% to $843,306), Waikato (up 27.1% to $865,592), Manawatu/Wanganui (up 26.5% to $659,622), Wellington (up 24.0% to $961,799), Bay of Plenty (up 21.4% to $945,971), Auckland (up 21.3% to $1,230,163), and Gisborne (up 11.0% to $661,663).
No regions went backwards year-on-year in October, but the West Coast is still the most affordable region to purchase a property. A home in the area was priced, on average, at $379,520 – up 20.0% when compared to October 2020.
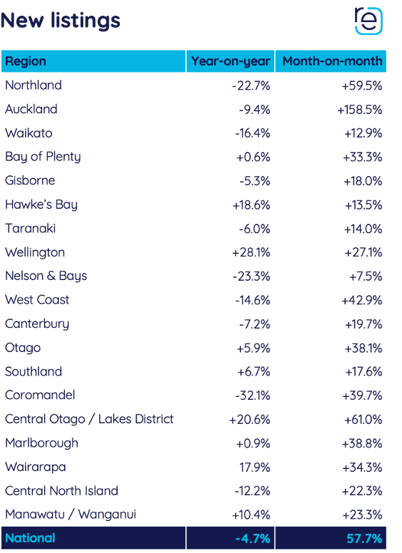
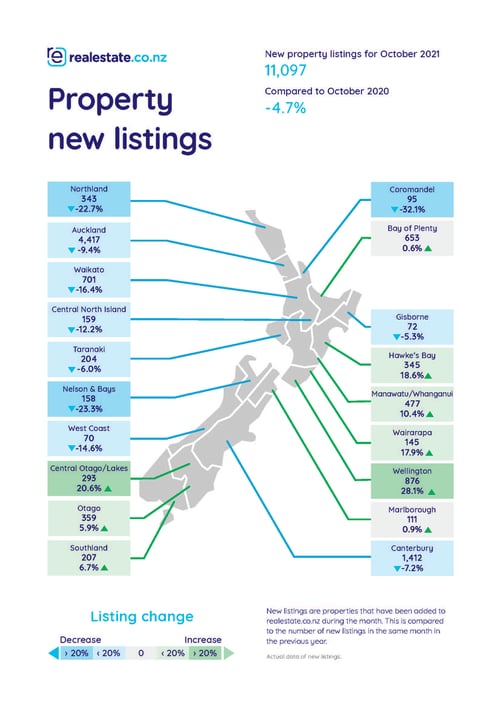
New listings start to bounce back, but it’s a mixed bag
In August and September, the market was impacted by lockdowns—both stock and new listings saw challenges. And while nationally new listings were down -4.7% year-on-year, realestate.co.nz saw a notable increase in new listings month-on-month.
“Overall, we saw new listings increase from September to October, ostensibly because Levels 2 and 3 meant that the market could transact,” said Vanessa. “But it’s been a bit difficult to pin down a trend in across the regions. The data is mixed.”
Regions like Wellington (up 28.1%), Central Otago / Lakes District (up 20.6%), Hawke’s Bay (up 18.6%) and Wairarapa (up 17.9%) all saw new listings increase year-on-year. But others, including the Coromandel (down -32.1%), Nelson & Bays (down -23.3%) and Northland (down -22.7%), seem to be having a slower start to the sales season.
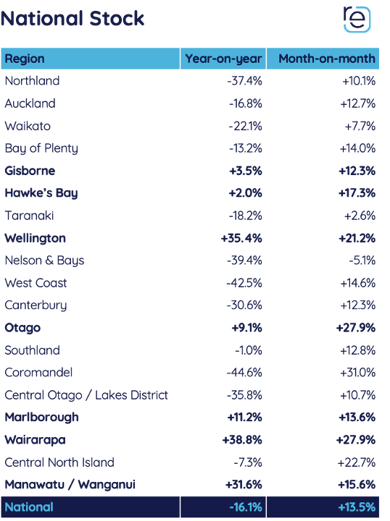
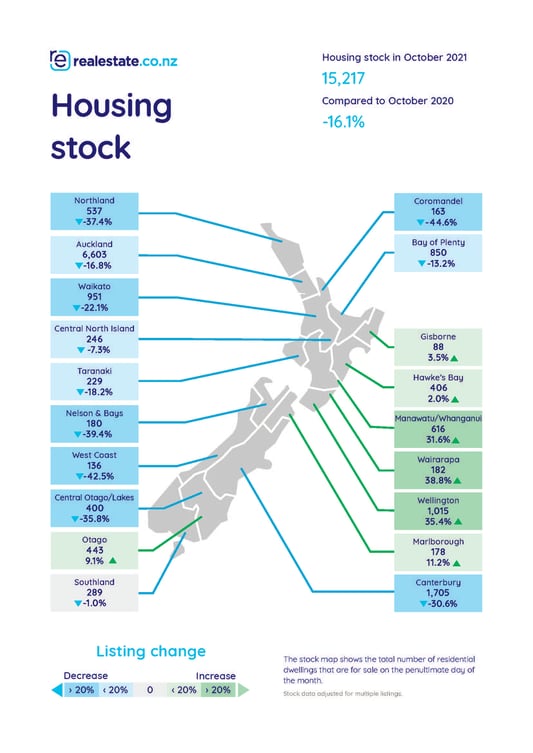
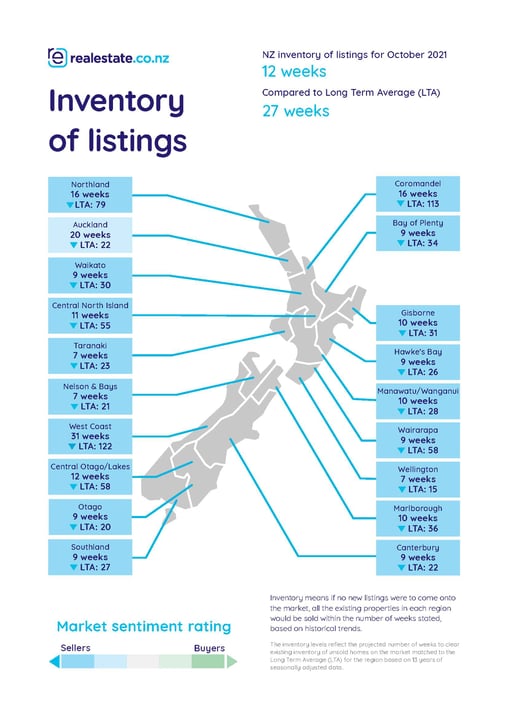
National stock down -16.1%, Heartening signs in the Lower North Island
October was realestate.co.nz’s second largest month in 2021, with 1.35 million users visiting the site. The company uses this metric as an indicator of demand in the market, which Vanessa says hasn’t wavered.
“Come rain, shine or lockdown, it seems there are plenty of buyers searching for property across the country,” said Vanessa. “But for years, we’ve seen supply not meeting that demand. This month, we’re starting to see signs of a shift, particularly in the Lower North Island.”
Wairarapa (up 38.8%), Wellington (up 35.4%), Manawatu / Wanganui (up 31.6%), Marlborough (up 11.2%), Otago (up 9.1%), Gisborne (up 3.5%) and Hawke’s Bay (up 2.0%) all saw stock increase year-on-year.
“This could mean one of two things: either demand is cooling in these regions, or more properties are being listed. Our site data suggests the later,” Vanessa continued.
“Interestingly, this is slightly out of character for New Zealand. In the past, we’ve seen Auckland leading trends—but it seems Wellington and the surrounding regions are leading the charge with stock availability,” said Vanessa. “The capital might bring winds of change.”
For media enquiries, please contact:
Ashley Harder | 021 712 210 | ashley@realestate.co.nz
As the longest-standing provider of real estate data in real-time, realestate.co.nz offers valuable property market information not available from other sources to make it easier for New Zealanders to buy and sell property.
Glossary of terms:
Average asking price (AAP) is neither a valuation nor the sale price. It is an indication of current market sentiment. Statistically, asking prices tend to correlate closely with the sales prices recorded in future months when those properties are sold. As it looks at different data, average asking prices may differ from recorded sales data released at the same time.
New listings are a record of all the new residential dwellings listed for sale on realestate.co.nz for the relevant calendar month. As the site reflects 97% of all properties listed through licensed real estate agents in New Zealand, this gives a representative view of the New Zealand property market.
Seasonal adjustment is a method realestate.co.nz uses to better represent the core underlying trend of the property market in New Zealand. This is done using methodology from the New Zealand Institute of Economic Research.
Truncated mean is the method realestate.co.nz uses to supply statistically relevant asking prices. The top and bottom 10% of listings in each area are removed before the average is calculated, to prevent exceptional listings from providing false impressions.
Stock is the total number of residential dwellings that are for sale on realestate.co.nz on the penultimate day of the month.
Share
-
.svg)
.svg)
.svg)