
.svg)


Click here to download this report as a print-ready PDF file.
Housing market continues to stabilise
April figures show Auckland in particular in wait-and-see mode
The housing market nationally continues to show signs of normalising, with prices in most regions stabilising, according to real-time data from realestate.co.nz.
In Auckland, there were 31.7 per cent more properties available for purchase in April 2017, compared to the same time last year. This jump in housing stock is good news for buyers, with more choice on offer.
“Auckland appears to be in a ‘wait-and-see’ mode right now,” says Vanessa Taylor, realestate.co.nz spokesperson. “A cooling in demand and an increase in the number of properties sitting on the market indicates that potential buyers are taking their time and exploring all of their options.”
The same can’t be said for the rest of New Zealand, with most regions recording an overall decrease in available housing stock. A total of 12 regions recorded a drop of more than 25 per cent, compared with a year ago.
The tighter stock position outside of Auckland is reflected particularly in the Hawke’s Bay, where stock is at an all-time low and the asking price for lifestyle properties is at an all-time high of just over $1.2 million.
“Hawke’s Bay has had an attraction for many people for some time and this has been accentuated in the recent past,” says Vanessa Taylor. Other areas that recorded an all-time low in stock include Gisborne, Manawatu-Wanganui, Northland and Taranaki.
The Wairarapa and Manawatu-Wanganui regions in particular are feeling the supply pinch, with the total number of properties available for purchase in April down 47.1 per cent and 40.3 per cent respectively. Other regions with significant declines in housing stock included Northland, Coromandel, Hawke’s Bay, Central North Island, Taranaki, Nelson, Marlborough, Southland and Otago.
Auckland is the only region with total stock up on a year ago and asking prices in the region are virtually unmoved since March this year (up 0.1 per cent).
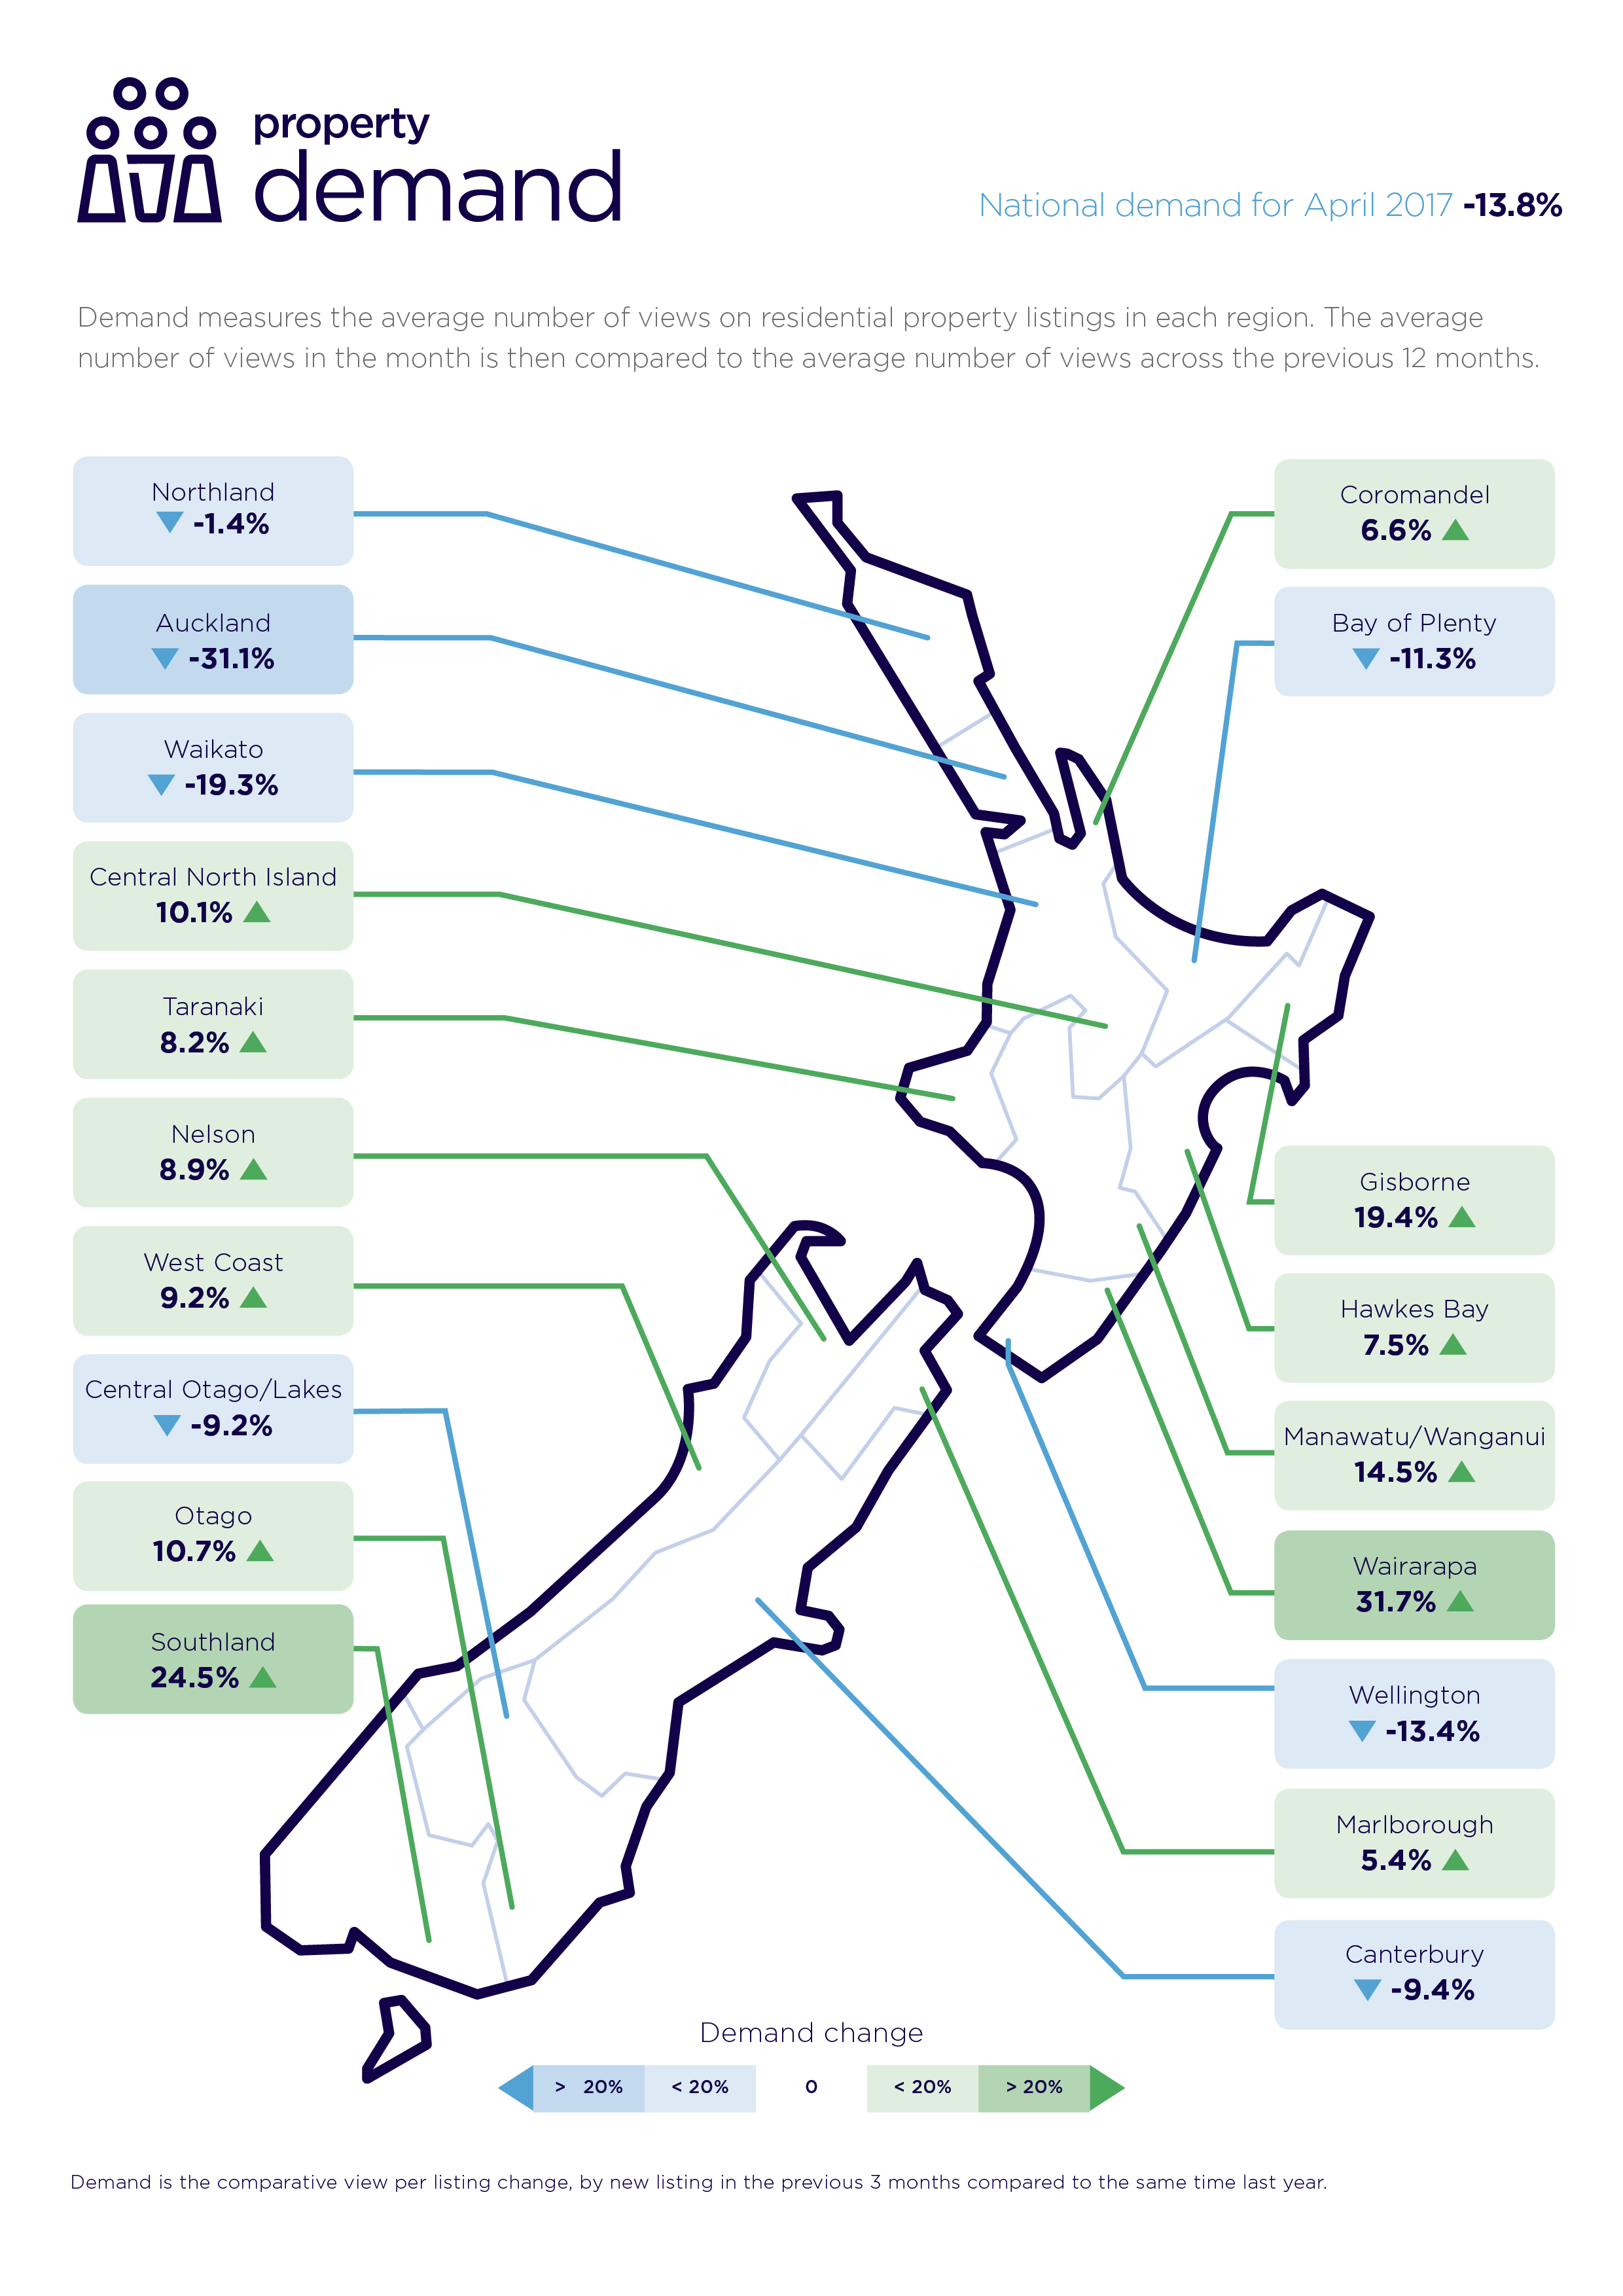
Residential housing demand down on average
Nationally, demand for residential housing has gone down by 13.8 per cent over the past three months. Demand in Auckland is down the most at 31.1 per cent over that period, followed by Waikato at 19.3 per cent. Other regions with a noticeable cooling in demand include Wellington (down 13.4 per cent), Bay of Plenty (down 11.3 per cent), Canterbury (down 9.4 per cent) and Central Otago (down 9.2 per cent).
However, demand for property climbed in the Wairarapa (up 31.7 per cent), Southland (up 24.5 per cent) and Gisborne (up 19.4 per cent) over the past three months.
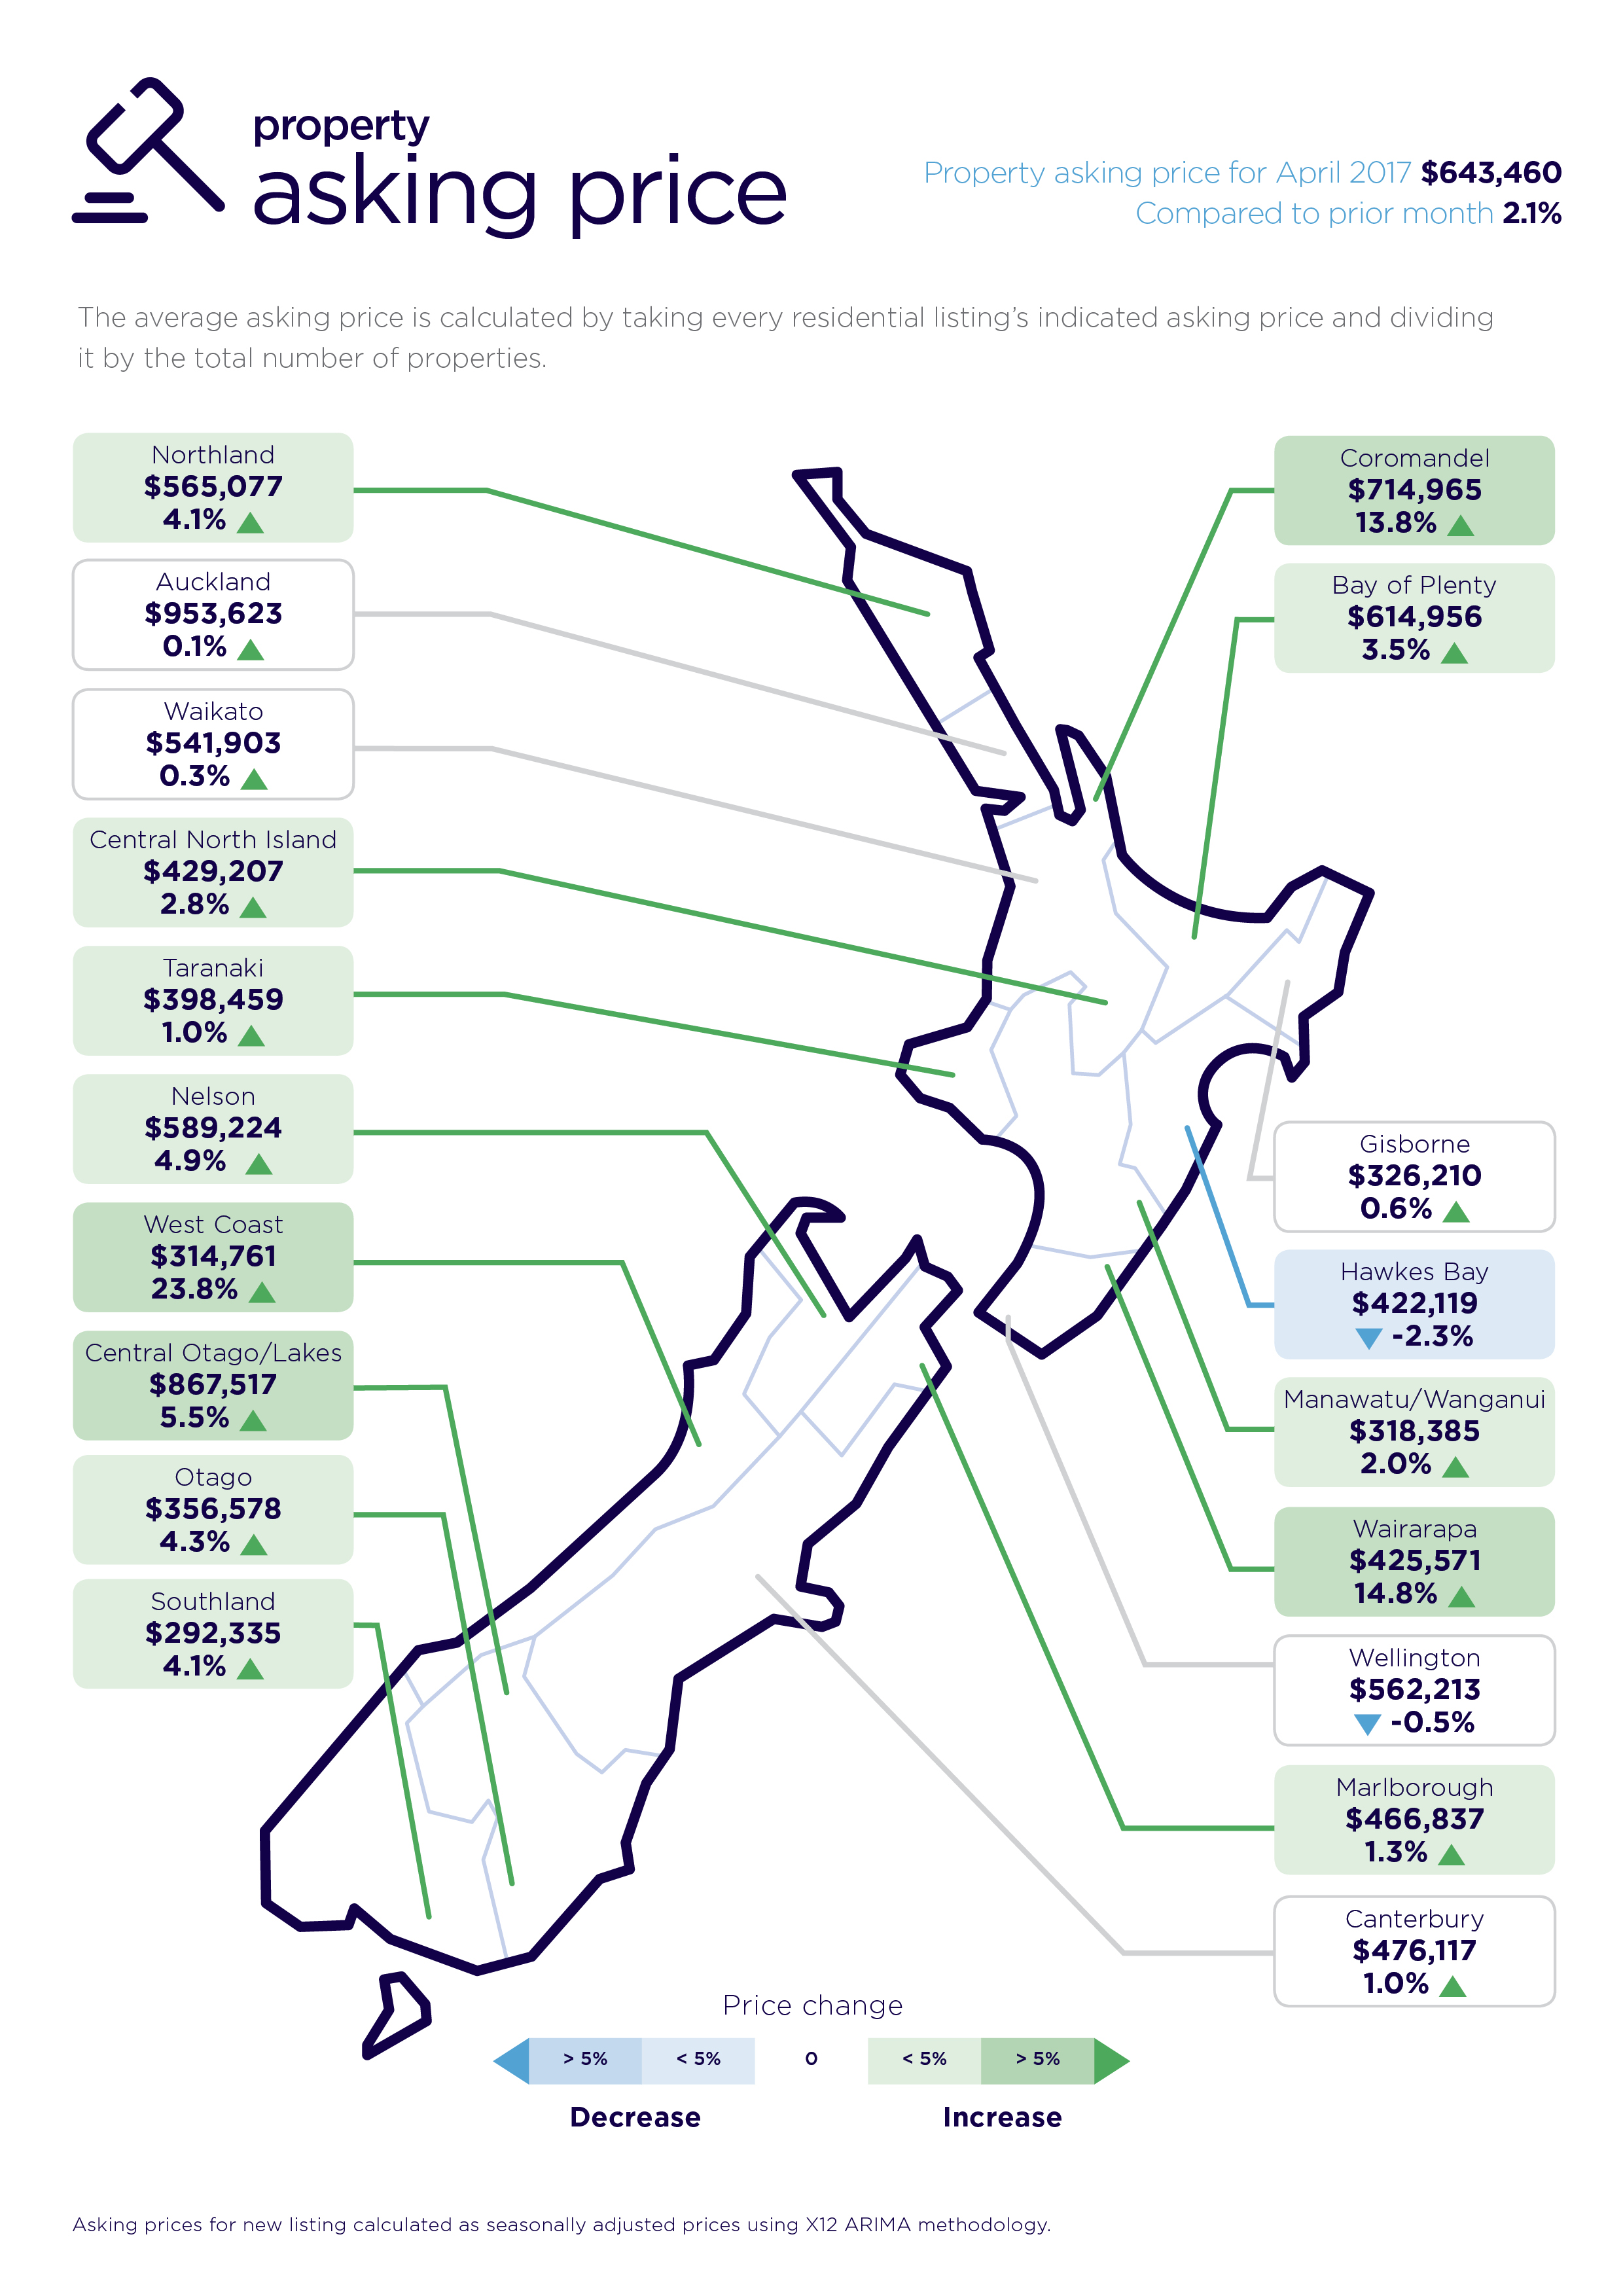
Asking prices stable in most regions
The average property asking price in April moved only 2.1 per cent above the previous month nationally, up to $643,460. In most regions, movement was negligible.
The exceptions were the West Coast (up 23.8 per cent to $314,761), Wairarapa (up 14.8 per cent to $425,571) and the Coromandel (up 13.8 per cent to $714,965).
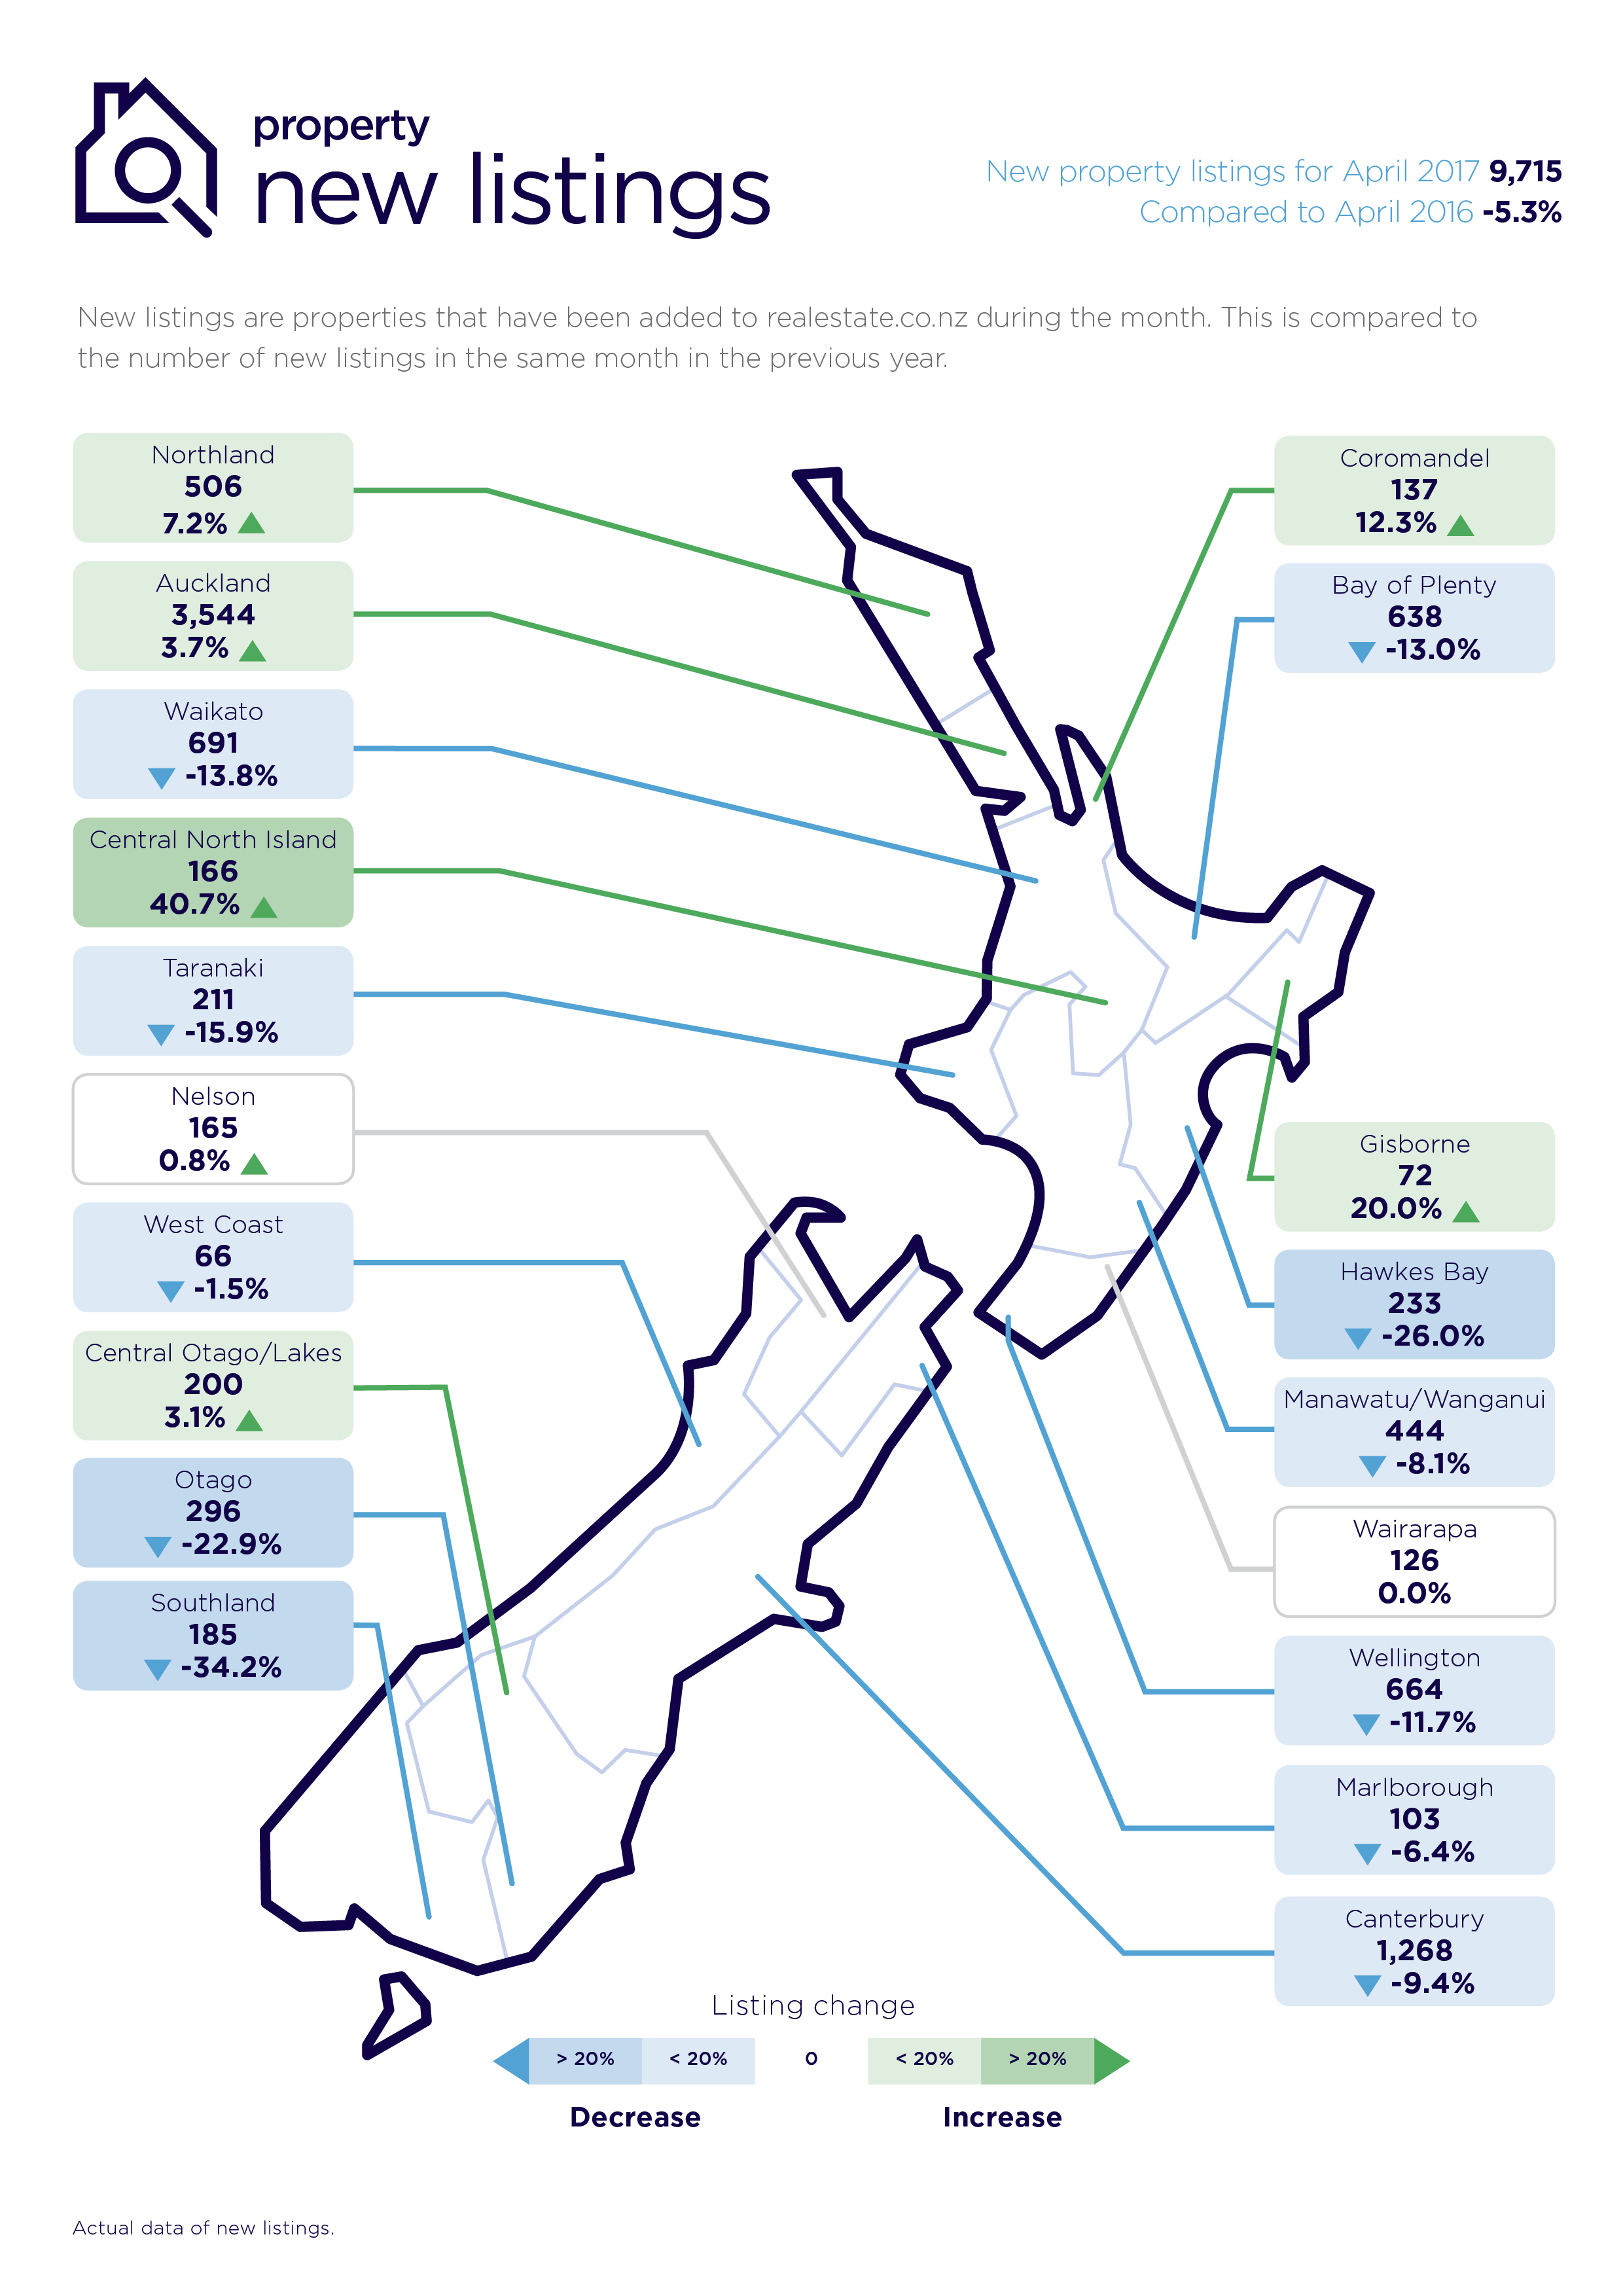
New property listings fall
Compared with a year ago, the number of properties newly listed for sale in April dropped 5.3 per cent.
“The tight market situation in the Hawke’s Bay is illustrated by the fact that compared with a year ago, new listings in that region in April were down 26 per cent,” said Vanessa Taylor. Otago, which was down 22.9 per cent, and Southland, 34.2 per cent lower, were among other regions where listings were negative.
The Central North Island was one stand-out region where new listings were up significantly, with an increase of 40.7 per cent compared with the same month in 2016.
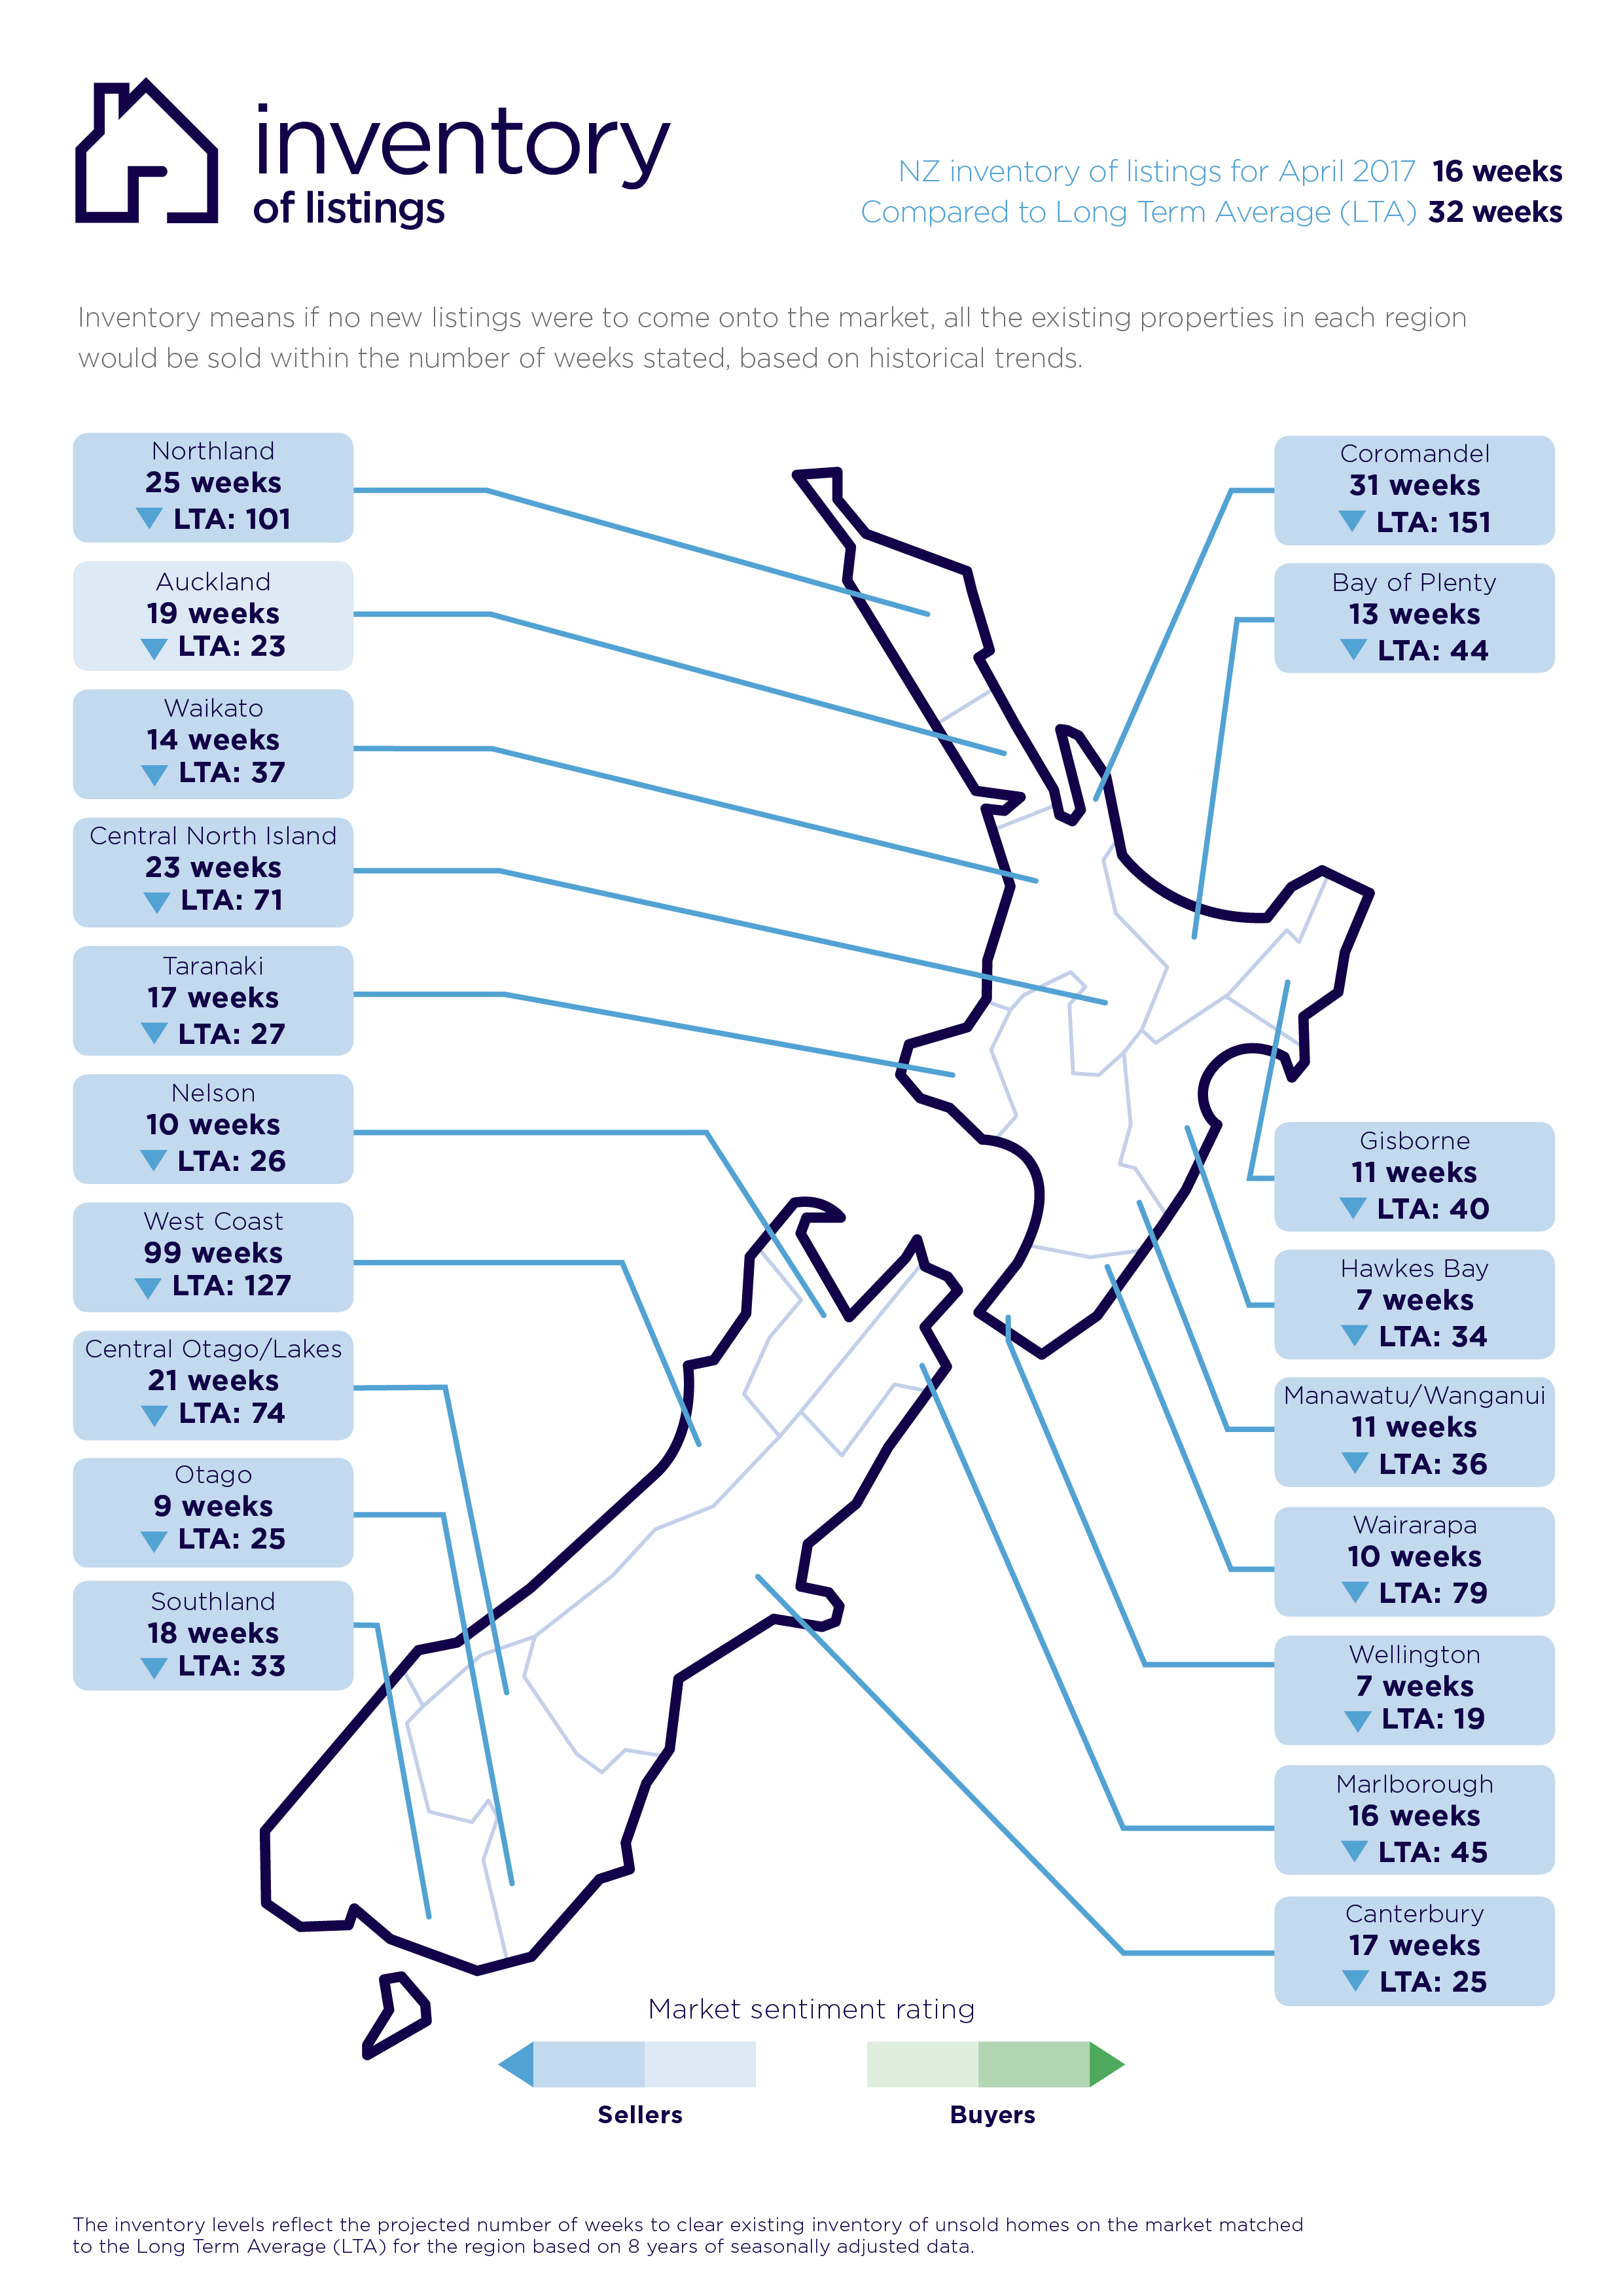
Inventory of listings illustrate regional differences
The tightness of the Hawke’s Bay market was further exemplified by the inventory of listings for April. Inventory is a measure of how long it would take, theoretically, for current housing stock to “sell out”, if no new listings were to come onto the market.
Against a long-term average of 34 weeks, Hawke’s Bay’s inventory levels dropped to just seven weeks in April. The low for the month was matched only by Wellington (long term average 19 weeks).
Inventory levels in Otago dipped to nine weeks in April, compared to a long term average for the region of 25 weeks. Other lows included 10 weeks in Nelson (long term average 26 weeks) and Wairarapa (long term average 79 weeks).
Nationally the inventory figure in April was 16 weeks, compared with a long-term average of 32 weeks.
About realestate.co.nz
Dedicated only to property, realestate.co.nz is the official website of the New Zealand real estate industry. As a property listing site, the information it draws on for its property report is in real time. With the country’s most comprehensive selection of real estate listings, realestate.co.nz represents more than 97 per cent of all residential, commercial and rural properties currently marketed by real estate professionals.
Glossary of terms
Being the only provider of real estate data in real time, realestate.co.nz offers valuable property market information not available from other sources.
• Average asking price gives an indication of current market sentiment. Statistically, asking prices tend to correlate closely with the sales prices recorded in future months when those properties are sold. As it looks at different data, average asking prices may differ from recorded sales data released at the same time.
• Inventory is a measure of how long it would take, theoretically, to sell the current stock
at current average rates of sale if no new properties were to be listed for sale. It provides a measure of the rate of turnover in the market.
• New listings are a record of all the new listings on realestate.co.nz for the relevant
calendar month. As realestate.co.nz reflects 97 per cent of all properties listed through registered
estate agents in New Zealand, this gives a representative view of the New Zealand property market.
• Seasonal adjustment is a method realestate.co.nz uses to better represent the core underlying trend of the property market in New Zealand. This is done using methodology from the New Zealand Institute of Economic Research.
• Truncated mean is the method realestate.co.nz uses to provide statistically relevant asking prices.
The top and bottom 10 per cent of listings in each area are removed before the average is
calculated, to prevent exceptional listings from providing false impressions.
• Demand: the comparative view per listing change, by new listing in the previous 3 months compared to the same time last year
For media enquiries, please contact:
Kate Carter, PPR
T: +64 21 514 004 E: kate.carter@ppr.co.nz
Share
-
.svg)
.svg)
.svg)