
.svg)


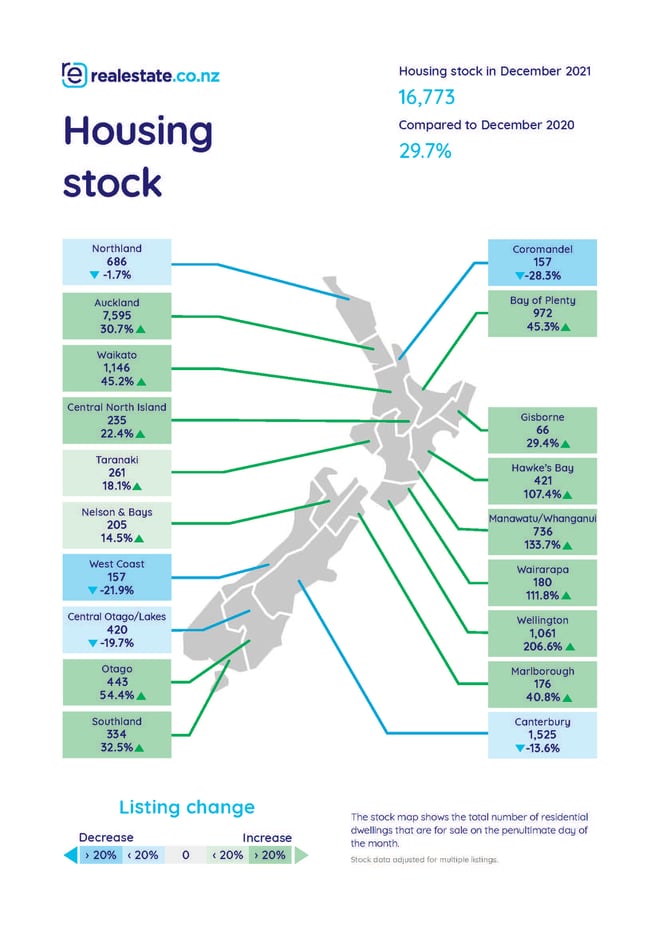
The latest data from realestate.co.nz suggests that national housing stock (the total number of homes available for Kiwis to purchase across the country) has gone up by nearly 30% since December 2020—an increase of about 4,000 properties.
Vanessa Williams, spokesperson for realestate.co.nz suggests that this data confirms an earlier theory—that the market is becoming more palatable for property seekers. “Buyers across the country have more choice coming into 2022. This could mean less FOMO (fear of missing out) and perhaps even more properties hitting the market,” said Vanessa. “If sellers are confident that they’ll be able to purchase after they sell, we could see this number continue to climb.”
Four regions saw their housing stock more than double year-on-year—Wellington (up 206.6%), Manawatu/Whanganui (up 133.7%), Wairarapa (up 111.8%) and Hawke’s Bay (up 107.4%). Other regions, including Otago (up 54.4%), the Bay of Plenty (up 45.3%), Waikato (up 45.2%) and Southland (up 32.5%) saw notable stock increases.
“It’s heartening to see more housing availability coming into 2022. It looks like there’s an exciting summer ahead for buyers and sellers alike.”
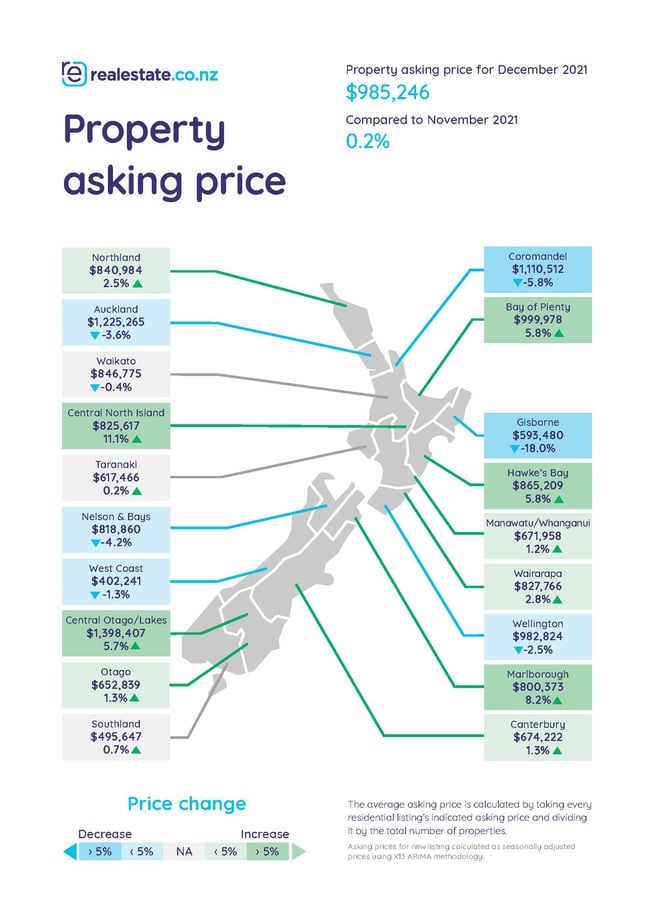
Nine regions hit record-high average asking prices
The national average asking price hit a 14-year record high in December; up 23.4% to $985,245 when compared to December 2020. Nine regions led—Hawke’s Bay (up 36.9% to $865,209), Wairarapa (up 30.1% to $827,766), Bay of Plenty (up 29.1% to $999,978), Central North Island (up 28.8% to $825,617), Canterbury (up 27.6% to $674,222) Manawatu/Whanganui (up 27.2% to $671,958), Otago (up 20.0% to $652,839), Taranaki (up 19.6% to $617,466) and Central Otago / Lakes District (up 19.1% to $1,398,407) all hit 14-year record high average asking prices year-on-year.
“Typically, more stock would result in cooling prices because buyers have more choice, but we haven’t seen that happen yet,” said Vanessa. “If stock continues its upward trend into 2022, it’ll be fascinating to watch the impact on asking prices.”
Central Otago / Lakes District, now nearing a $1.4 million average asking price, holds a firm grip on its reign as the most expensive region to purchase a property in the country. Auckland (up 18.5% to $1,225,265) and the Coromandel (up 25.2% to $1,110,512) follow in second and third place respectively.
Green shoots of new listings spring up across the country
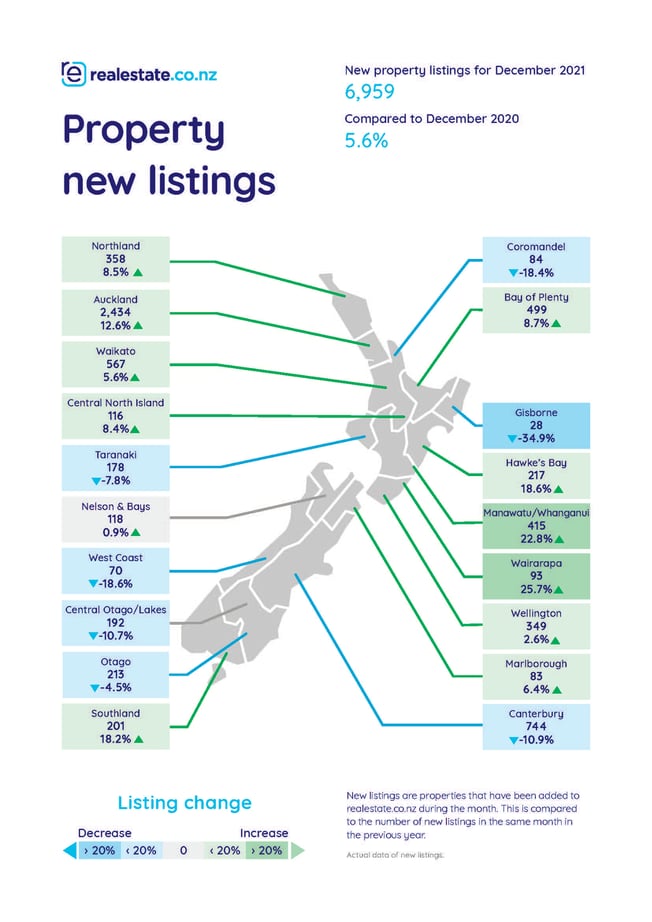
Although December is often a quiet month, when compared to 2020, new listings on realestate.co.nz saw a 5.6% increase. “December is usually a “short” month for the property market—Kiwis are winding down for the holidays, so we usually only see activity to the middle of the month,” said Vanessa. “But with significant restrictions still in place in December, it was heartening to see vendors active right up until the festive break.”
In fact, several regions saw new listings increase year-on-year. Most notably, Wairarapa (up 25.7%), Manawatu/Whanganui (up 22.8%), Hawke’s Bay (up 18.6%) and Southland (up 18.2%), while others, including Gisborne (down -34.9%), the West Coast (down -18.6%) and the Coromandel (down -18.4%) saw new listings decrease year-on-year.
New listings in each region were very mixed last month—some regions saw significant increases year-on-year, while others seemed to quiet down for the holidays—resulting in a moderate increase in new listings nationally,” said Vanessa.
How to spot a buyer’s market
New Zealand has been in a bona fide seller’s market for about a decade, and the country is a good distance away from anything that looks like a buyer’s market. But there have been several recent reports from experts that predict a range of outcomes for the housing market, including a dip in prices and even a “correction” that would result in a buyer’s market.
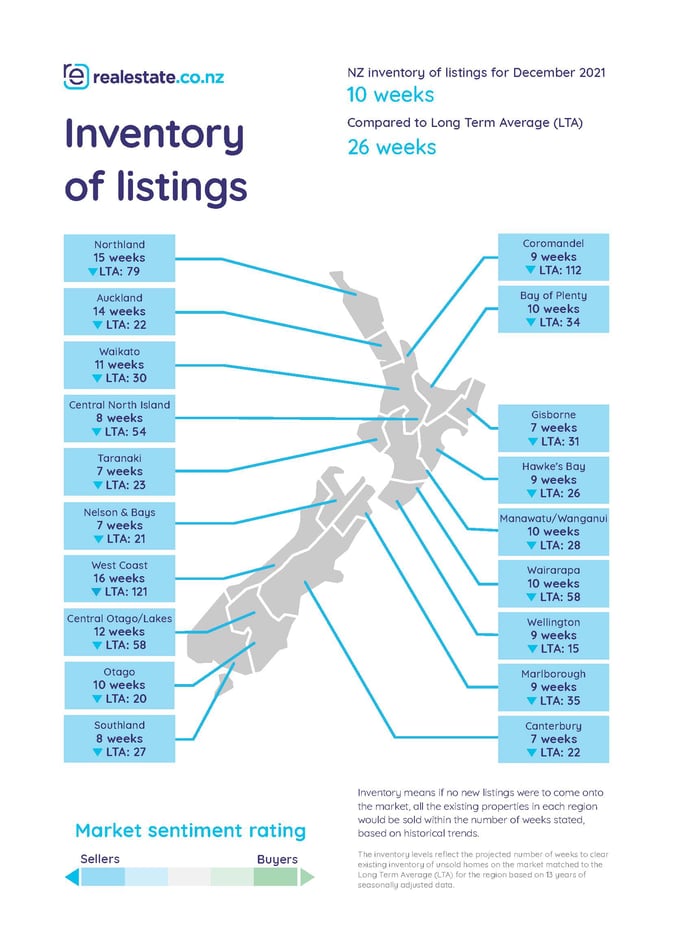
But how do we spot a buyer’s market? realestate.co.nz measures this regularly through our inventory of listings to monitor market sentiment.
“We use sales data from the Real Estate Institute of New Zealand and our own stock data to find the inventory clearance rate and compare it to our long-term average.”
“This gives us a good indication of how each region is tracking—for example, Wellington’s current inventory clearance rate is nine weeks, but the long-term average is 15 weeks. Because December’s clearance rate is lower than the long-term average, this indicates a seller’s market,” says Vanessa.
“This measurement is a reliable indication of market sentiment.”
For media enquiries, please contact:
Ashley Harder | 021 712 210 | ashley@realestate.co.nz
As the longest-standing provider of real estate data in real-time, realestate.co.nz offers valuable property market information not available from other sources to make it easier for New Zealanders to buy and sell property.
Glossary of terms:
Average asking price (AAP) is neither a valuation nor the sale price. It is an indication of current market sentiment. Statistically, asking prices tend to correlate closely with the sales prices recorded in future months when those properties are sold. As it looks at different data, average asking prices may differ from recorded sales data released at the same time.
New listings are a record of all the new residential dwellings listed for sale on realestate.co.nz for the relevant calendar month. As the site reflects 97% of all properties listed through licensed real estate agents in New Zealand, this gives a representative view of the New Zealand property market.
Seasonal adjustment is a method realestate.co.nz uses to better represent the core underlying trend of the property market in New Zealand. This is done using methodology from the New Zealand Institute of Economic Research.
Truncated mean is the method realestate.co.nz uses to supply statistically relevant asking prices. The top and bottom 10% of listings in each area are removed before the average is calculated, to prevent exceptional listings from providing false impressions.
Stock is the total number of residential dwellings that are for sale on realestate.co.nz on the penultimate day of the month.
Share
-
.svg)
.svg)
.svg)