
.svg)


But is it actually a good time to sell?
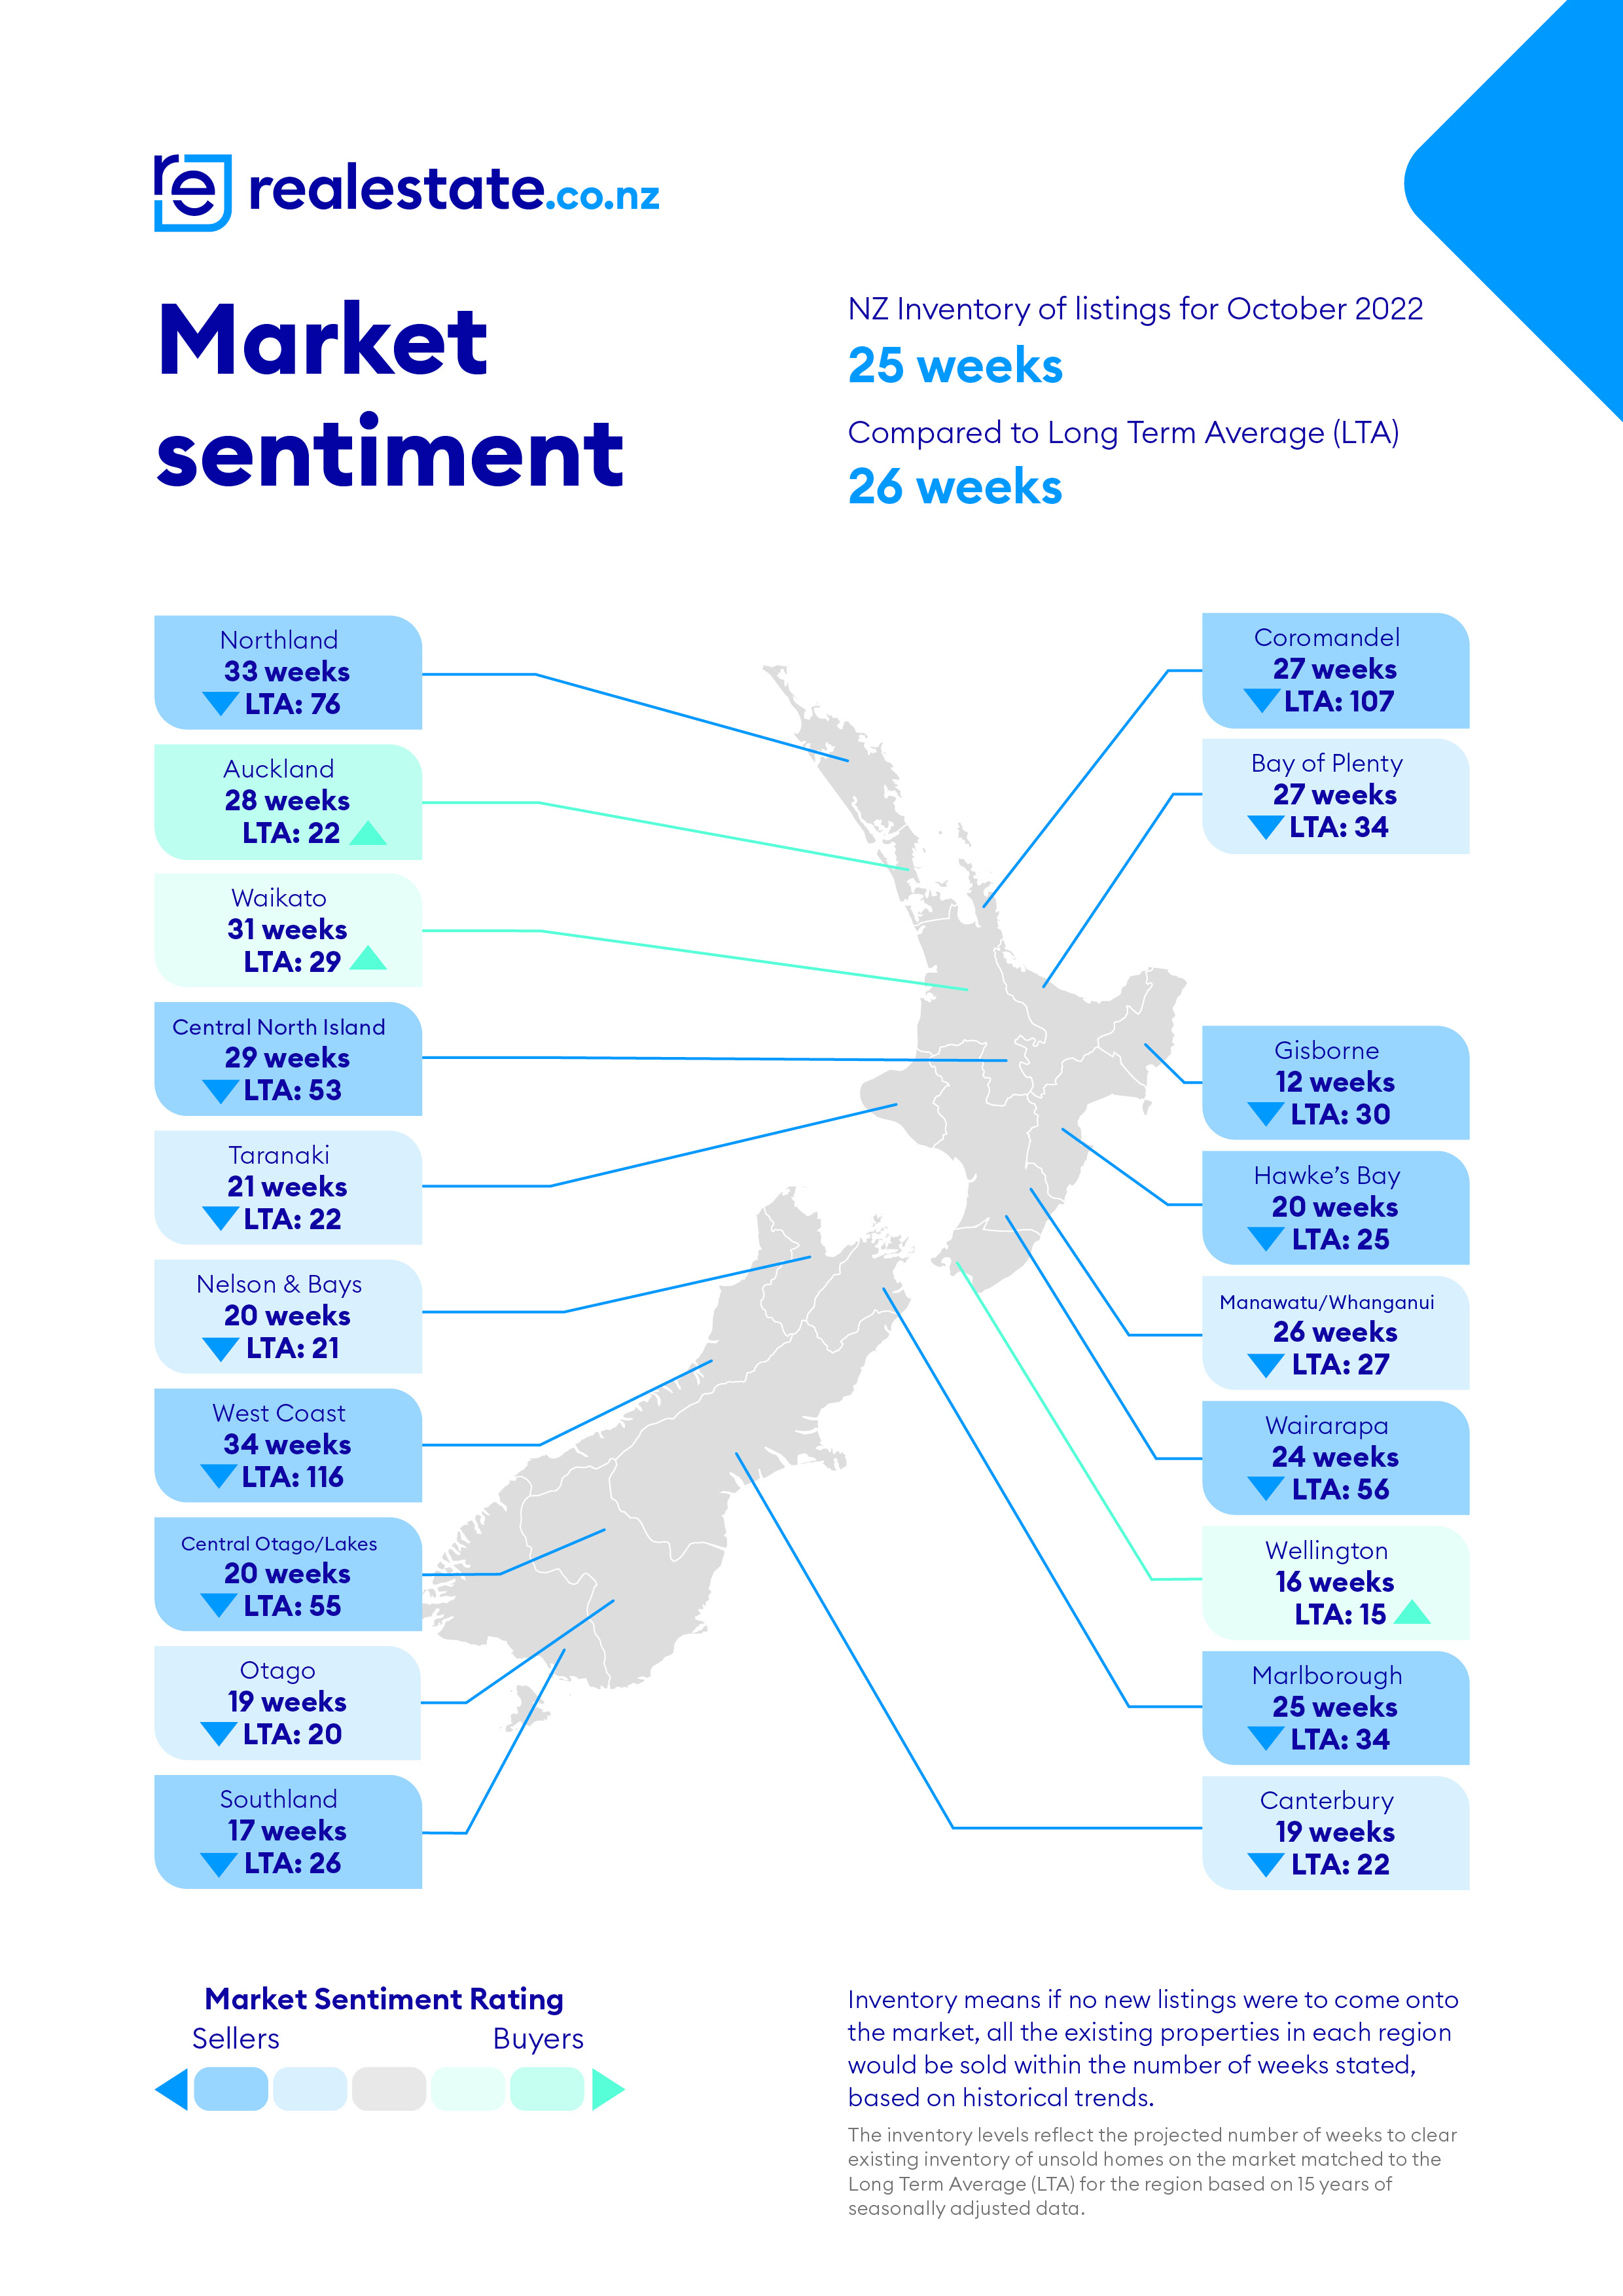
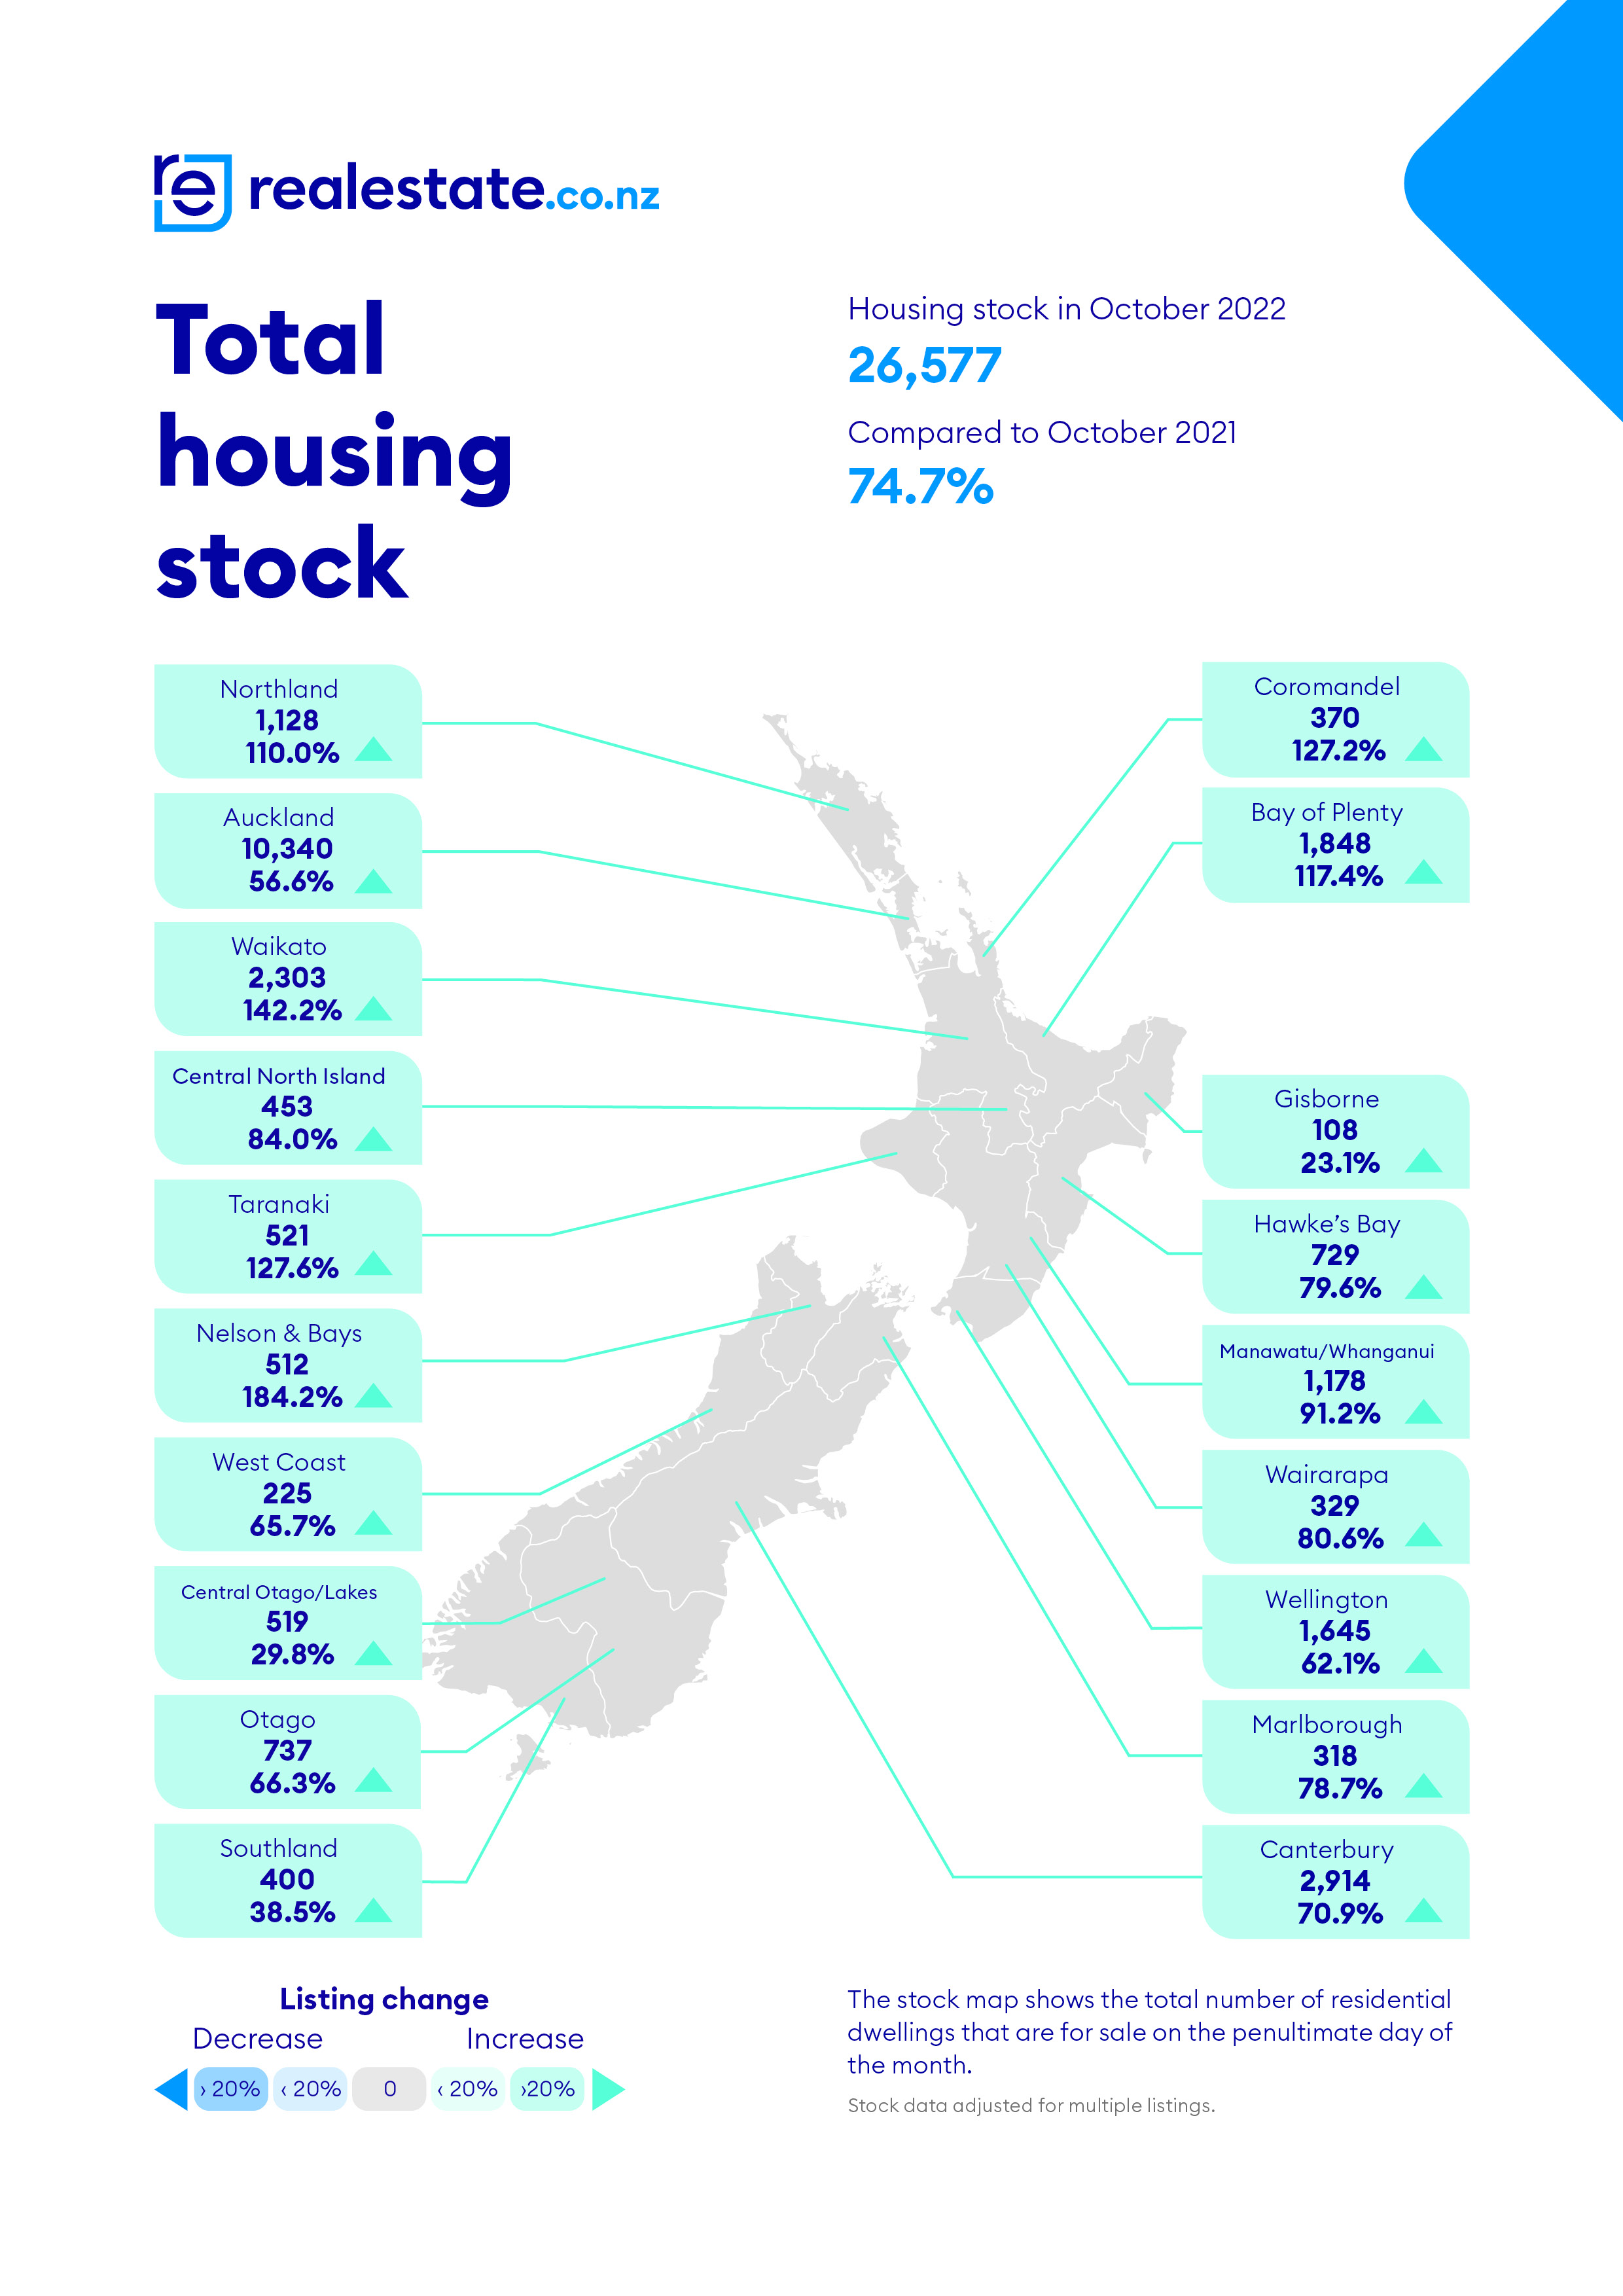
After reporting rising housing stock levels, buyers’ markets in major centres and downward trending asking prices since the property market’s peak in January 2022, new data from realestate.co.nz suggests the changing market may have spooked some potential vendors this October.
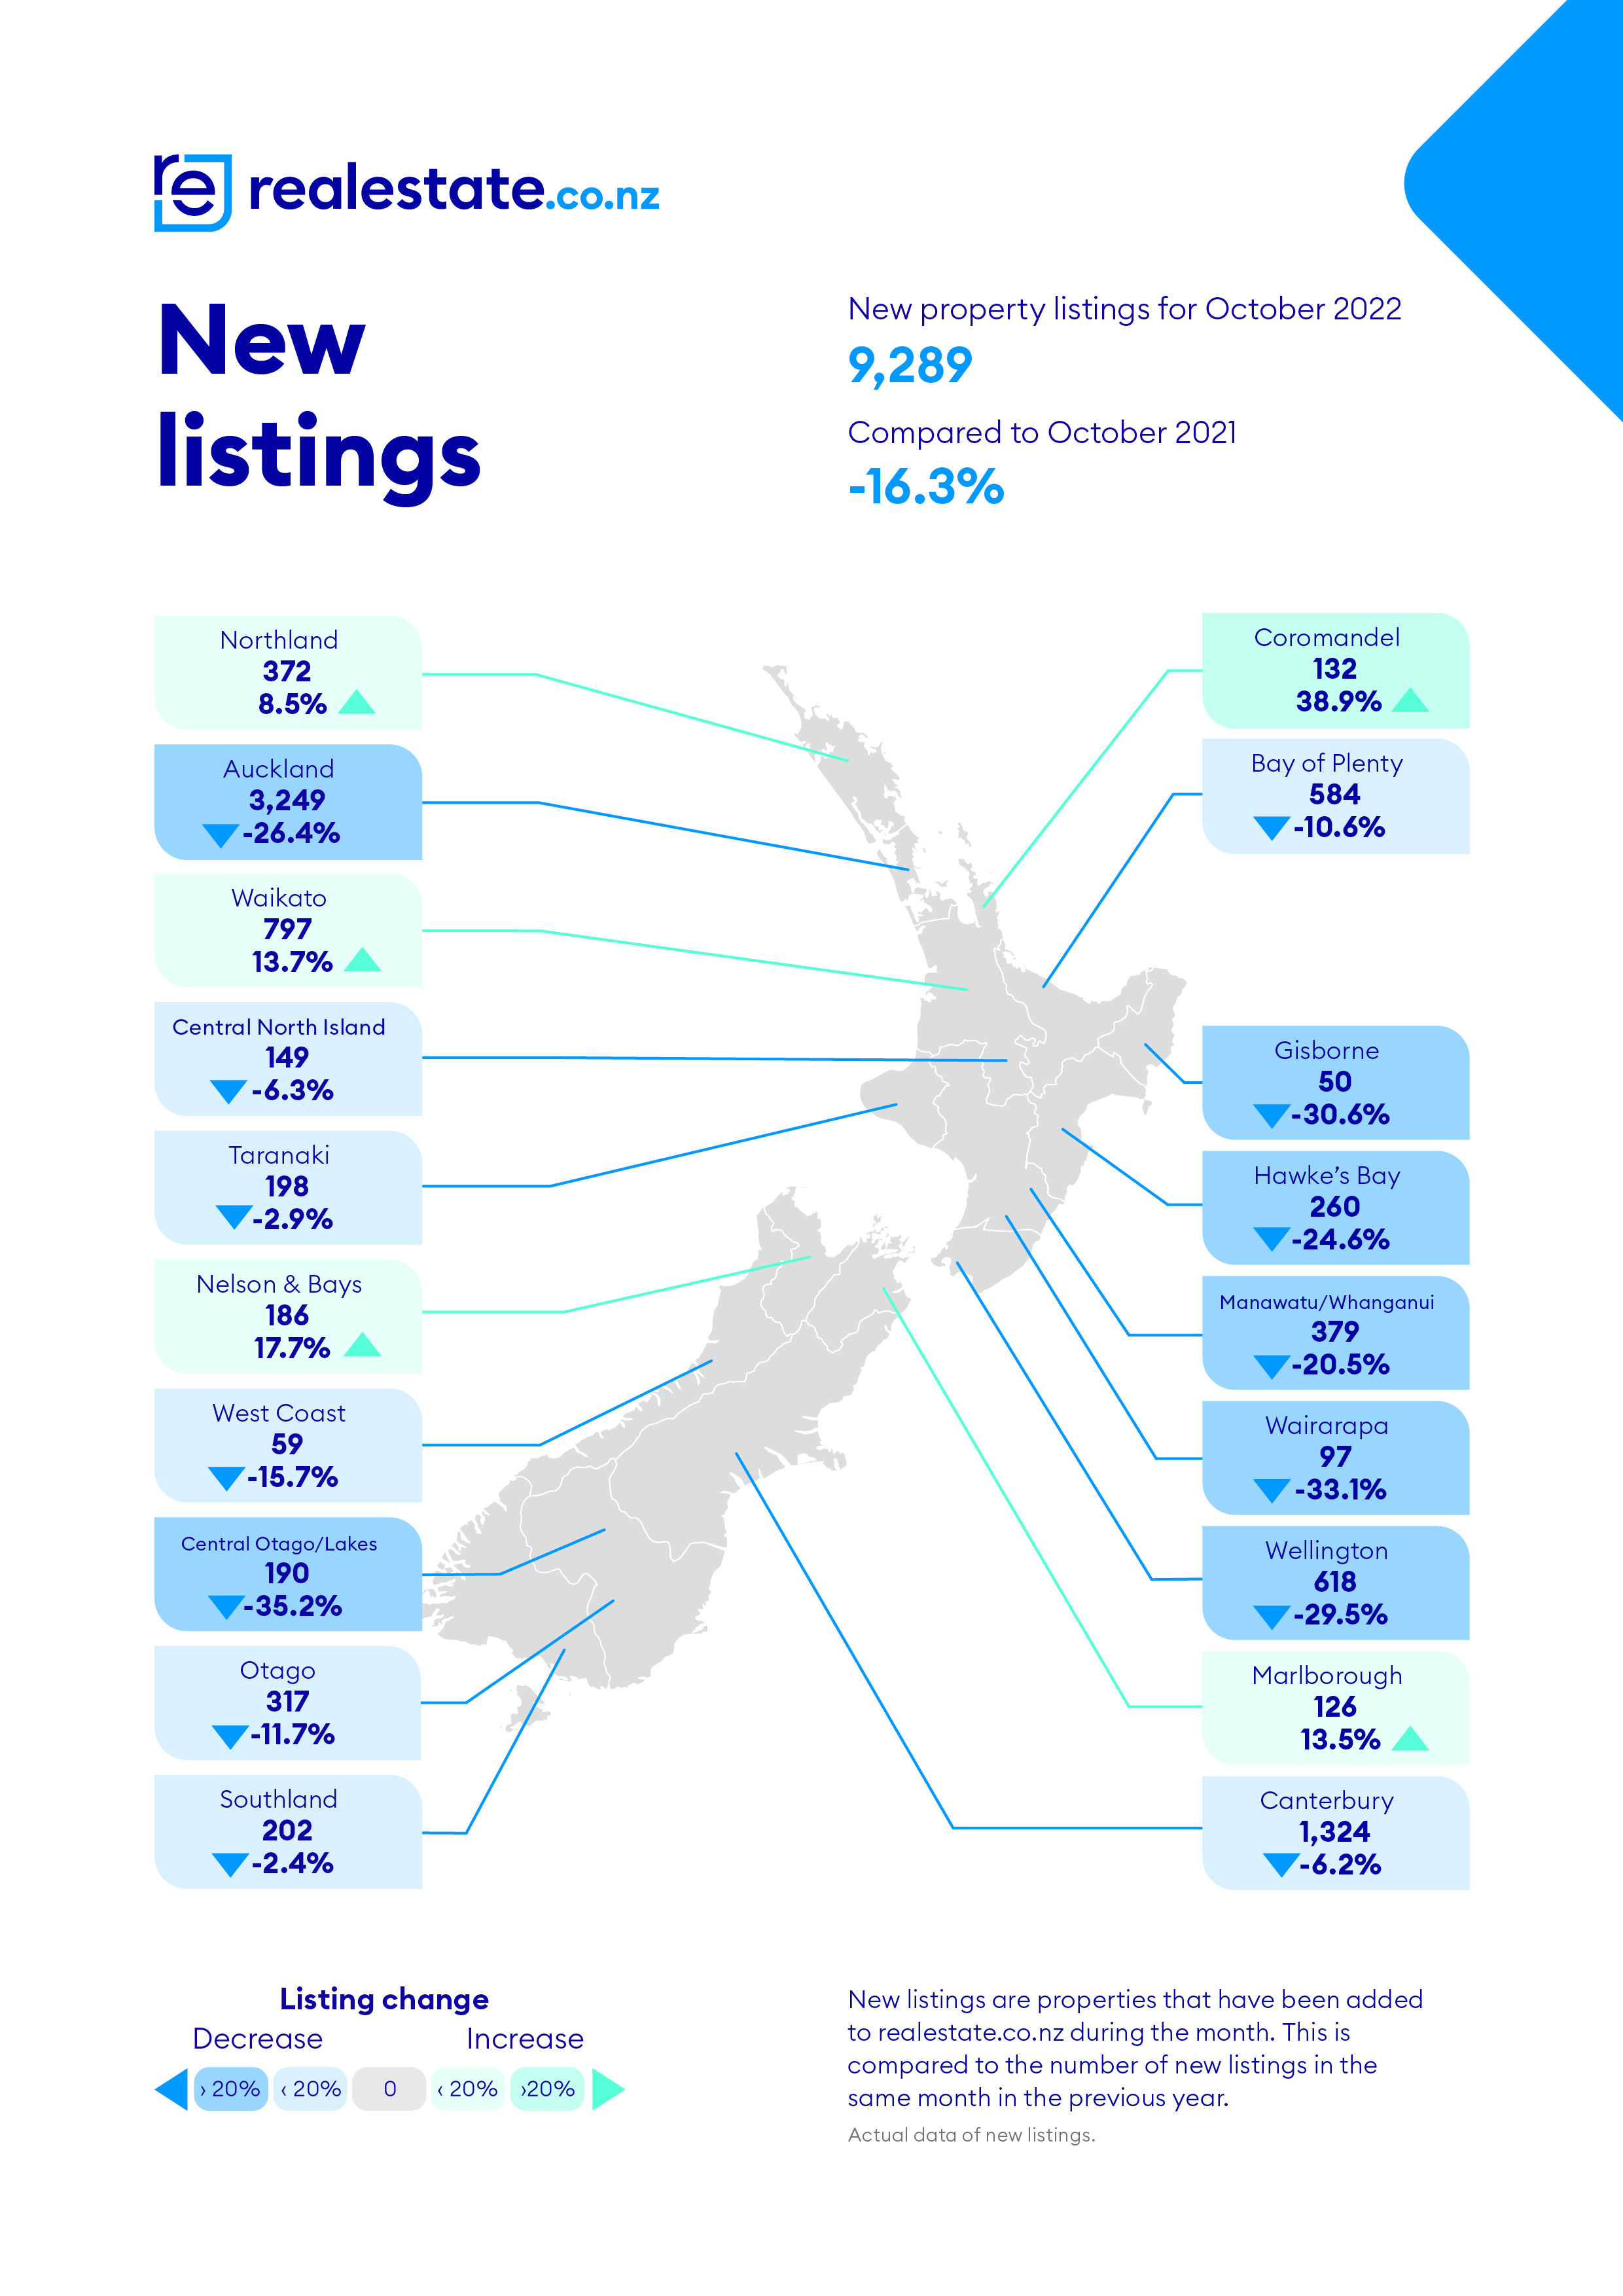
When compared to October 2021, new listings on realestate.co.nz were down nationally and in 14 of New Zealand’s 19 regions.
Vanessa Williams, spokesperson for realestate.co.nz, says it is noteworthy to see such a drop in new listings when you consider that much of the country was in and out of COVID-19 lockdowns this time last year.
“Year on year, -16.3% fewer new listings came onto our site during October, suggesting that property owners shied away from putting their homes on the market in October, which is usually a major month for residential listings,” says Vanessa.
“Uncertainty has an impact on the property market. Last year the pandemic was impacting buying and selling. Now the uncertainty has shifted to the cost of living and inflation, as well as rising interest rates. This might be driving vendors to sit tight as we navigate this changing landscape.”
The biggest drops in new listing numbers were seen in Central Otago/Lakes District (190, down -35.2%), Wairarapa (97, down -33.1%) and Gisborne (50, down -30.6%). Bucking the trend, however, with double-digit growth in new listings, were Coromandel (132, up 38.9%), Nelson & Bays (186, up 17.7%), Waikato (797, up 13.7%), %), and Marlborough (126, up 13.5%).
National asking price gently ticks downward; the regions tell a different story
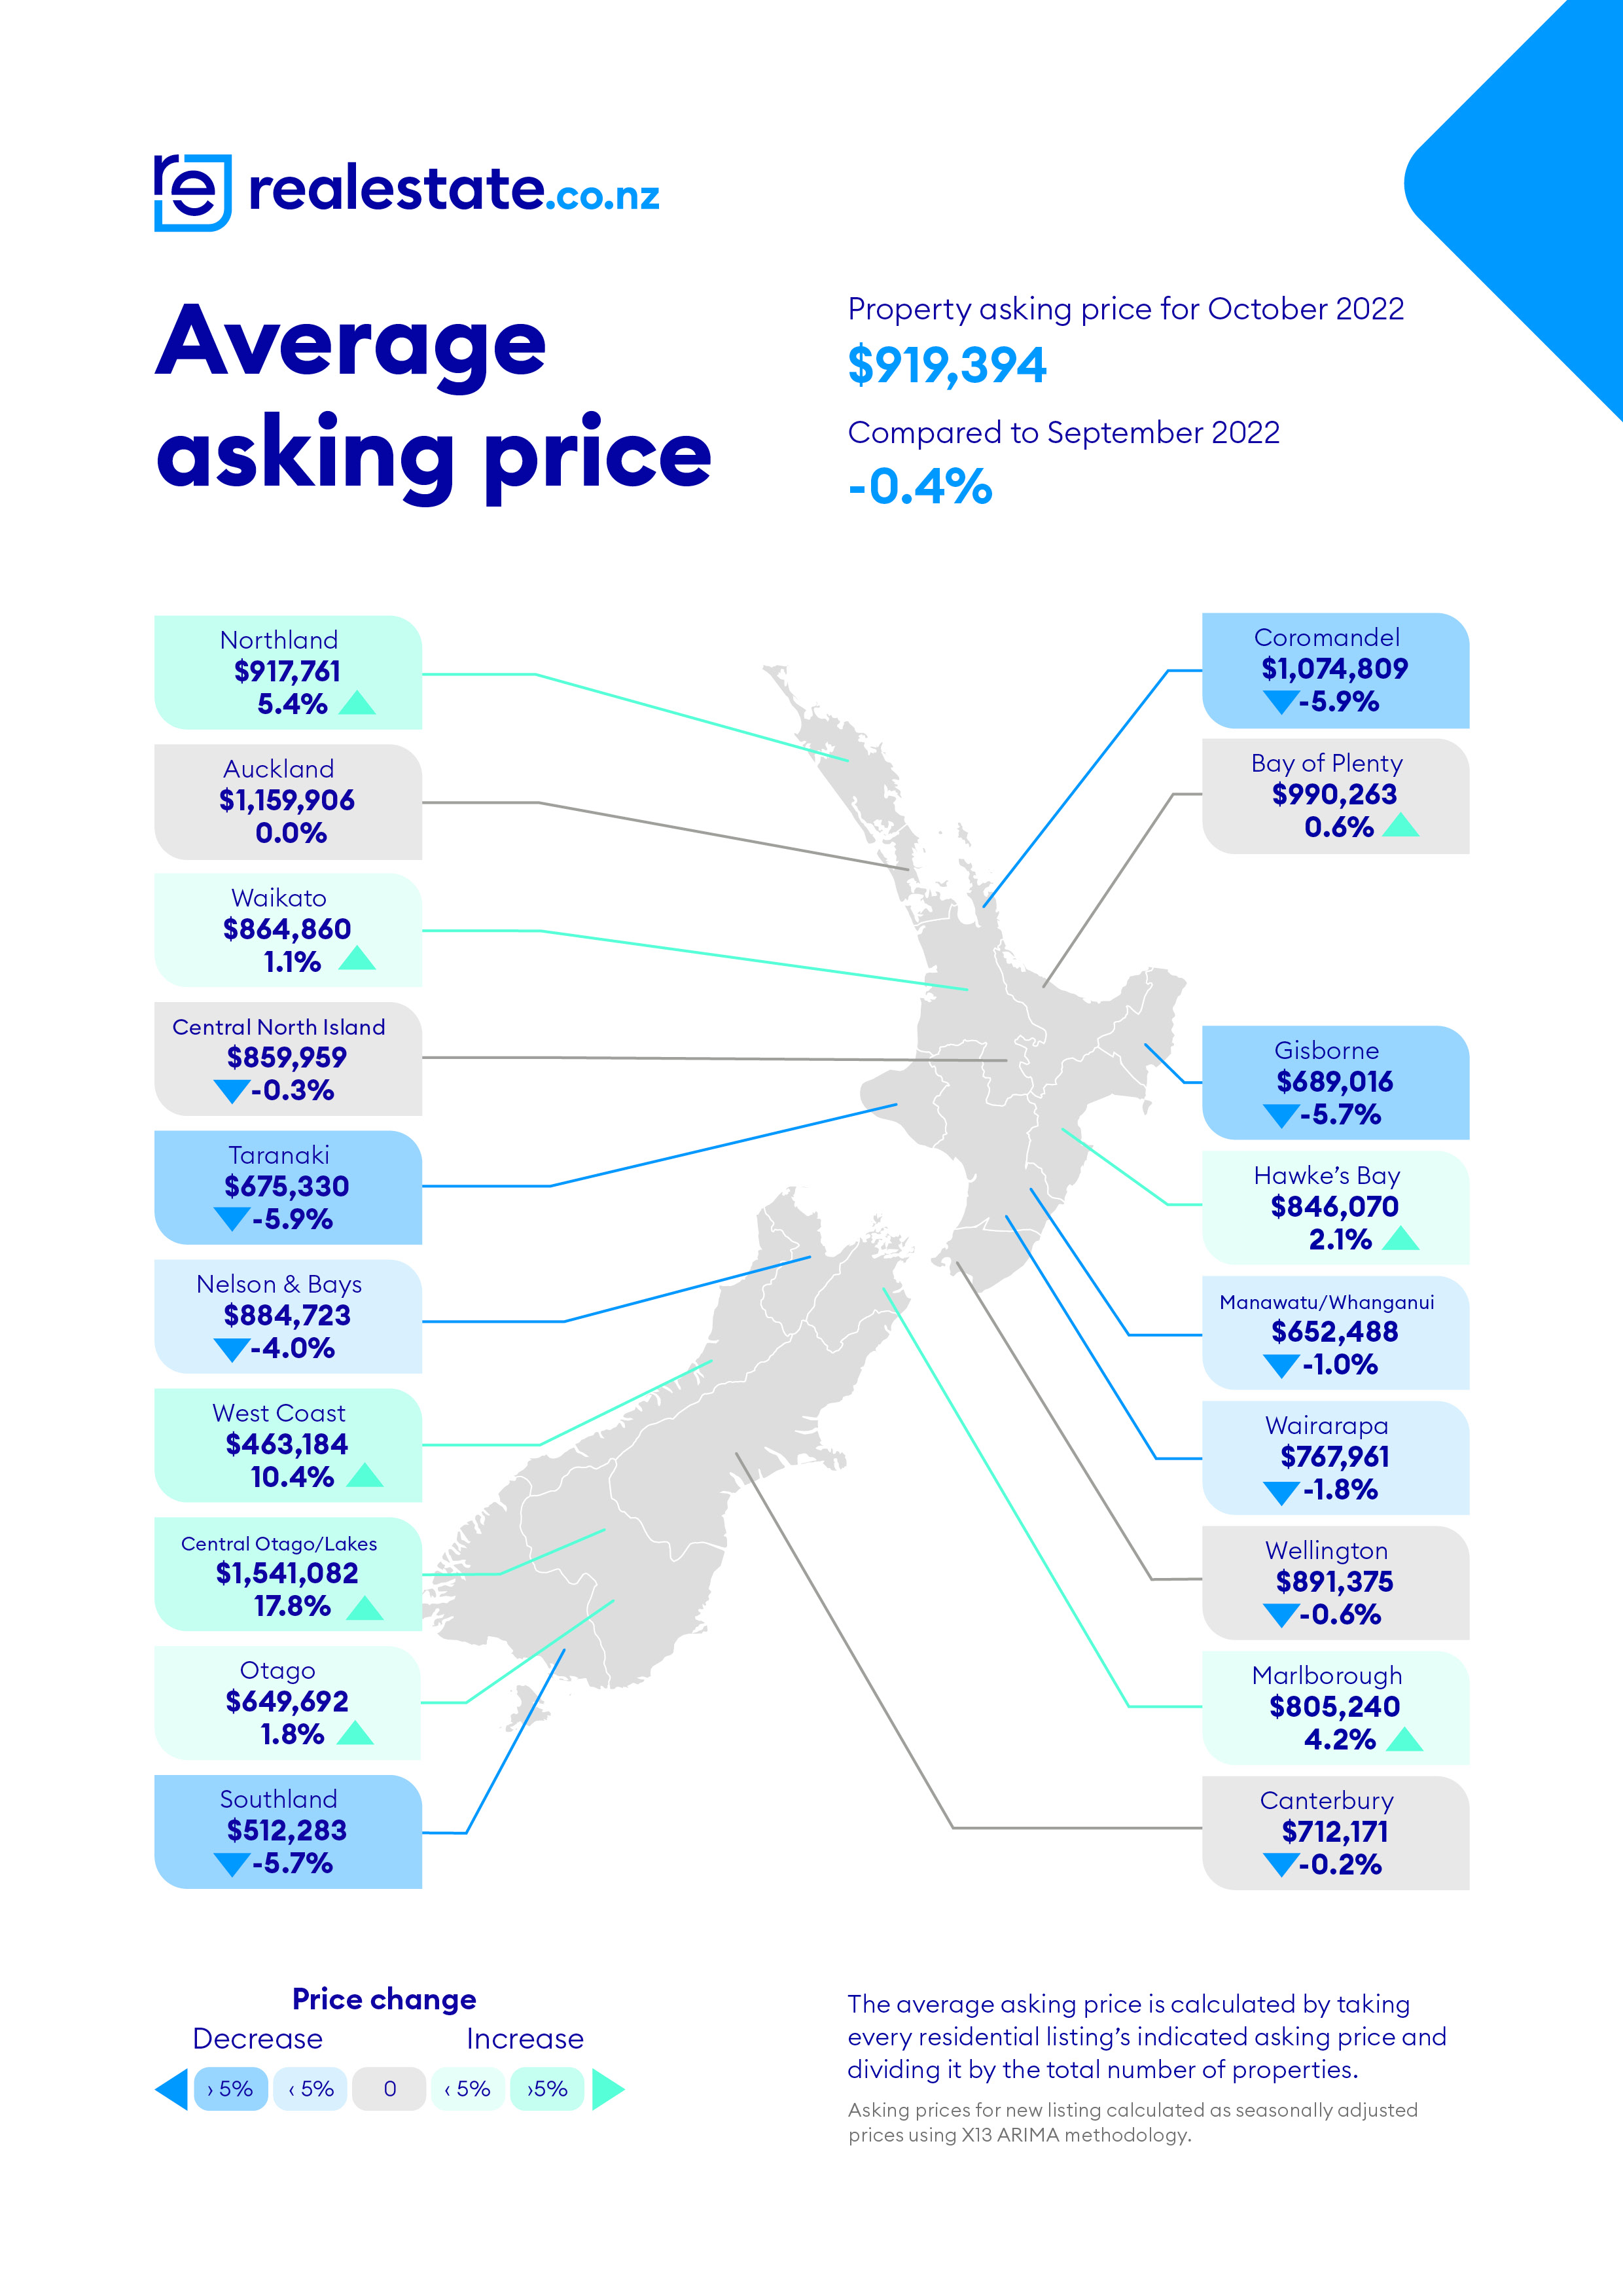
Cooling asking prices in major centres has driven the national average asking price downward since its peak in January 2022.
Wellington saw the largest month-on-month decrease, dipping -7.7% to $891,375, followed by Auckland (down -6.2% to $1,159,906), Wairarapa (down -5.6% to $767,961) and the Coromandel (down -2.9% to $1,074,809).
Vanessa suggests this is still a good time to be a seller.
In October, users to realestate.co.nz increased by 11.7% month-on-month, and page views also increased.
“When prices ease, it reignites hesitant buyers back into the market—from all different segments. Anecdotally we have heard of many first-home buyers coming back into the market, along with investors,” said Vanessa.
“But prices are a mixed bag across Aotearoa; not all regions are softening.”
In fact, there were still five regions with double-digit year-on-year price growth—the West Coast (up 22.0% to $463,184), Northland (up 16.8% to $917,761), Marlborough (up 15.1% $805,240), Taranaki (up 12.5% to $675,330), and Canterbury (up 10.4% to $712,171).
“Despite the cooling average asking prices in our major centres, 13 regions still bucked the trend, five of which showed double-digit year-on-year growth. And we did have one very notable anomaly…”
Central Otago/Lakes becomes the first region to hit a $1.5m average asking price
For the first time in New Zealand’s history, one of its regions hit an average asking price of over $1.5 million, allowing for seasonal adjustment—a 15-year record high.
“A home near the Remarkables is now priced, on average, at $1,541,082, up 8.3% year-on-year—now about $400,000 dearer than a home in Auckland,” says Vanessa.
About realestate.co.nz
As New Zealand’s longest-standing property website, realestate.co.nz’s mission is to empower New Zealanders with a property search tool they can use to find the life they want to live. With residential, lifestyle, rural and commercial property listings, realestate.co.nz is the place to start for those looking to buy or sell property.
Whatever life you’re searching for, it all starts here.
Glossary of terms:
Average asking price (AAP) is neither a valuation nor the sale price. It is an indication of current market sentiment. Statistically, asking prices tend to correlate closely with the sales prices recorded in future months when those properties are sold. As it looks at different data, average asking prices may differ from recorded sales data released simultaneously.
New listings are a record of all the new residential dwellings listed for sale on realestate.co.nz for the relevant calendar month. The site reflects 97% of all properties listed through licensed real estate agents and major developers in New Zealand. This description gives a representative view of the New Zealand property market.
Seasonal adjustment is a method realestate.co.nz uses to represent better the core underlying trend of the property market in New Zealand. This is done using methodology from the New Zealand Institute of Economic Research.
Truncated mean is the method realestate.co.nz uses to supply statistically relevant asking prices. The top and bottom 10% of listings in each area are removed before the average is calculated to prevent exceptional listings from providing false impressions.
Share
-
.svg)
.svg)
.svg)