
.svg)


Data shows asking and selling prices have followed the same general trend in all New Zealand regions for more than 15 years.
The data, from realestate.co.nz and the Real Estate Institute of New Zealand (REINZ), shows average asking prices and median selling prices have followed an almost identical trendline, nationally and in every region, since 2007.
Asking prices, on average, have sat just 5.7% higher than selling prices nationally, with the percentage difference varying in the regions from the smallest gap of 2.8% in the Central North Island to the largest gap of 7.1% in the Central Otago/Lakes region. 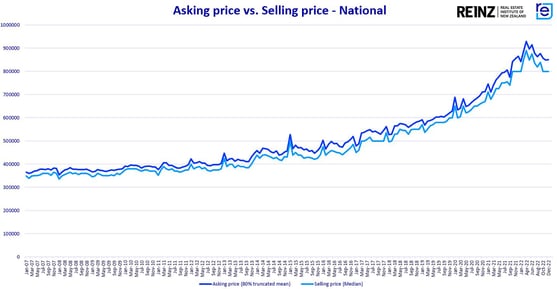
The analysis compares the asking price of a property listed on realestate.co.nz with the price that the property sells for as supplied by REINZ. The aggregated average difference across all properties listed and sold during the past 15 years is then calculated. A total of 667,307 properties were listed and sold during this period and are accounted for in the analysis.
When the average asking price goes up or down on realestate.co.nz, the median selling price tends to follow suit four to six weeks later when the properties listed have sold.
This shows that asking prices, which are set based on up-to-date local knowledge, are a useful tool for both agents and vendors in understanding market trends. The strong link between the two prices indicates that agents are serving their vendors well by advising a listing price that is realistic to what the property will sell for.
While asking prices sit just above selling prices over the long term, the data does, however, show short-term fluctuations. This means sellers aren’t always asking above market value; as, demand and market sentiment can have a substantial impact. In a competitive market, for example, it is not uncommon to see properties selling for above the asking price.
The realestate.co.nz Market Insights tool shows asking prices and selling prices for every suburb in New Zealand. The suburb trend graph maps the two data sets over time, with options to view by one year, three years, and ten years.
Check out your suburb for an up-to-date indication of where prices are currently sitting and trends over time.
About realestate.co.nz
As New Zealand’s longest-standing property website, realestate.co.nz’s mission is to empower New Zealanders with a property search tool they can use to find the life they want to live. With residential, lifestyle, rural and commercial property listings, realestate.co.nz is the place to start for those looking to buy or sell property.
Whatever life you’re searching for, it all starts here.
About REINZ
REINZ is a membership organisation with more than 17,000 members (representing around 90% of the real estate profession). Our members span the breadth of real estate services, including residential sales, rural/lifestyle, auctioneering, business broking, commercial and industrial sales and leasing, and property management.For over 100 years, REINZ has promoted the growth of and professional excellence within the real estate industry. Our purpose is to champion a world class real estate profession.
Want more property insights?
- Market insights: Search by suburb to see median sale prices, popular property types and trends over time.
- Sold properties: Switch your search to sold to see recent sales and prices.
- Valuations: Get a gauge on property prices by browsing comparable property sales.
Share
-
.svg)
.svg)
.svg)