
.svg)


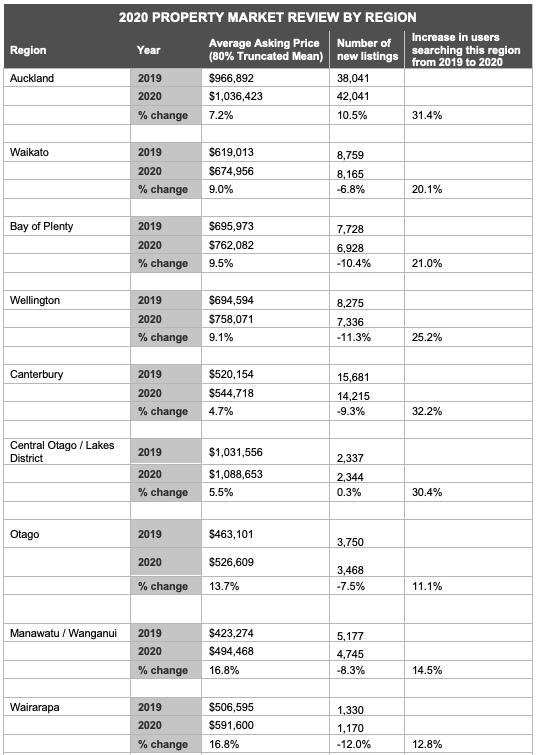
Covid-19 did little to dampen the New Zealand property market last year. New annual data from realestate.co.nz shows that as prices soared, so too did demand with 23.0% more users searching for property nationally when compared to 2019.
Also increasing by 227.8%, the number of people searching for property in 2020 more than tripled when compared to 2016.
Vanessa Taylor, spokesperson for realestate.co.nz, says that despite all the challenges that came with 2020, our love affair with property didn’t diminish:
“Up 10.7% to $775,976, properties in New Zealand, on average, cost $75,056 more in 2020 than they did in 2019. Coupled with the record demand, this tells us that people didn’t shy away from buying and selling last year.”
Vanessa says that all property listed on realestate.co.nz in 2020 totalled an asking price sum of $94 billion*, up 5.4% on $90 billion in 2019.
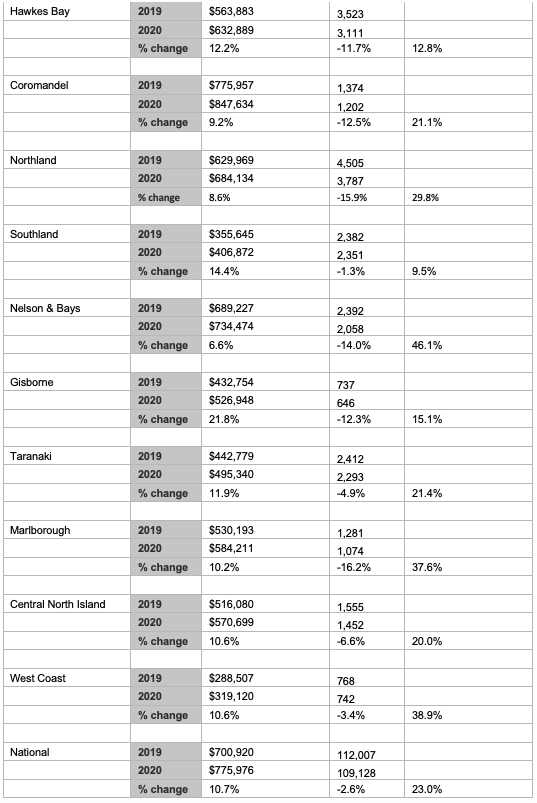
Demand from users searching for property at realestate.co.nz rose in every region in 2020, with the most significant increases seen in the South Island. Searches were up 46.1% in Nelson & Bays, 38.9% in West Coast and 37.6% in Marlborough.
However, the increase in demand wasn’t matched by the number of properties that came onto the market, says Vanessa.
Nationally, 109,128 properties were listed for sale in 2020 – a 2.6% decrease on the 112,007 properties that hit the market in 2019.
Marlborough property seekers were most squeezed for choice last year, with 16.2% fewer homes coming on to the market in the region compared to 2019. In Northland, new listings were down 15.9% on 2019 and in Nelson & Bays they dropped 14.0%.
“What we’ve seen quite clearly throughout 2020 is demand for property outweighing supply, which could have contributed to price increases,” says Vanessa.
Only Auckland bucked the trend, with a 10.5% increase in listings in 2020, while Central Otago/Lakes recorded a marginal increase of 0.3%.
“In Auckland we’ve started to see a change, with the large number of new homes being built exceeding demand caused by population growth. But supply is still tight because of the shortfall in previous years.”
Average asking prices were up year-on-year in every New Zealand region in 2020, as well as nationally.
The largest price increase during 2020 was in Gisborne, where average asking prices were up 21.8% on 2019 to $526,948. This was followed by Wairarapa and Manawatu/Whanganui, both up 16.8% to $591,600 and $494,468 respectively. Southland prices increased 14.4% to $406,872 and Otago was up 13.7% to $526,609.
*Where a display price is not supplied the search price has been used.
ENDS
For media enquiries, please contact:
Lindsay Clark | 021 0300 455 | lindsay@brainchild.co.nz
About realestate.co.nz
Established before Google, in 1996, realestate.co.nz is New Zealand’s longest-standing property site. With residential, lifestyle, rural and commercial property listings available, realestate.co.nz is the place where serious buyers look for property. Dedicated to property, realestate.co.nz has no private sales and has search functionality that’s second to none to get you to your perfect property faster.
Glossary of terms:
As the only provider of real estate data in real-time, realestate.co.nz offers valuable property market information not available from other sources.
- Average asking price is not a valuation. It is an indication of current market sentiment. Statistically, asking prices tend to correlate closely with the sales prices when those properties are sold. As it looks at different data, average asking prices may differ from recorded sales data released at the same time.
- New listings are a record of all the new listings on realestate.co.nz for the relevant time period. As realestate.co.nz reflects 97% of all properties listed through registered estate agents in New Zealand, this gives a representative view of the New Zealand property market.
- Increase in users searching this region from 2019 to 2020 is the percentage change to the number of users searching in a particular region for property. This does not reference the geographical location of the users but the region they are searching.
- Truncated mean is the method realestate.co.nz uses to provide statistically relevant asking prices. The top and bottom 10% of listings in each area are removed before the average is calculated, to prevent exceptional listings from providing false impressions.
Share
-
.svg)
.svg)
.svg)