Vanessa Williams, spokesperson for realestate.co.nz, says that the data doesn't support the "bubble burst" that some have speculated.
In contrast to skyrocketing average asking prices and stock shortages of the COVID-19 era, the New Zealand market has cooled down in 2022; and the latest data from realestate.co.nz suggests that the market may have now stabilised.
Vanessa Williams, spokesperson for realestate.co.nz, says there has been some real change in the market during 2022, but the data suggests the market might be back to normal after an unprecedented couple of years thanks to the pandemic:
“During June last year, we saw all-time asking price highs in 15 of 19 regions plus record stock shortages across the country. As a result, there was a lot of urgency in the market with demand significantly exceeding supply.”

However, she says that June 2022’s data tells a different story, with average asking prices in most regions staying relatively flat compared to May 2022. The property market is offering plenty of choice for buyers, with stock levels also up significantly compared to last year.
“Kiwis are adjusting to living through a pandemic, and it looks like our property market is also settling after the disruption of the last two years.”
“Right now, we are seeing more stability than we have for some time,” says Vanessa.
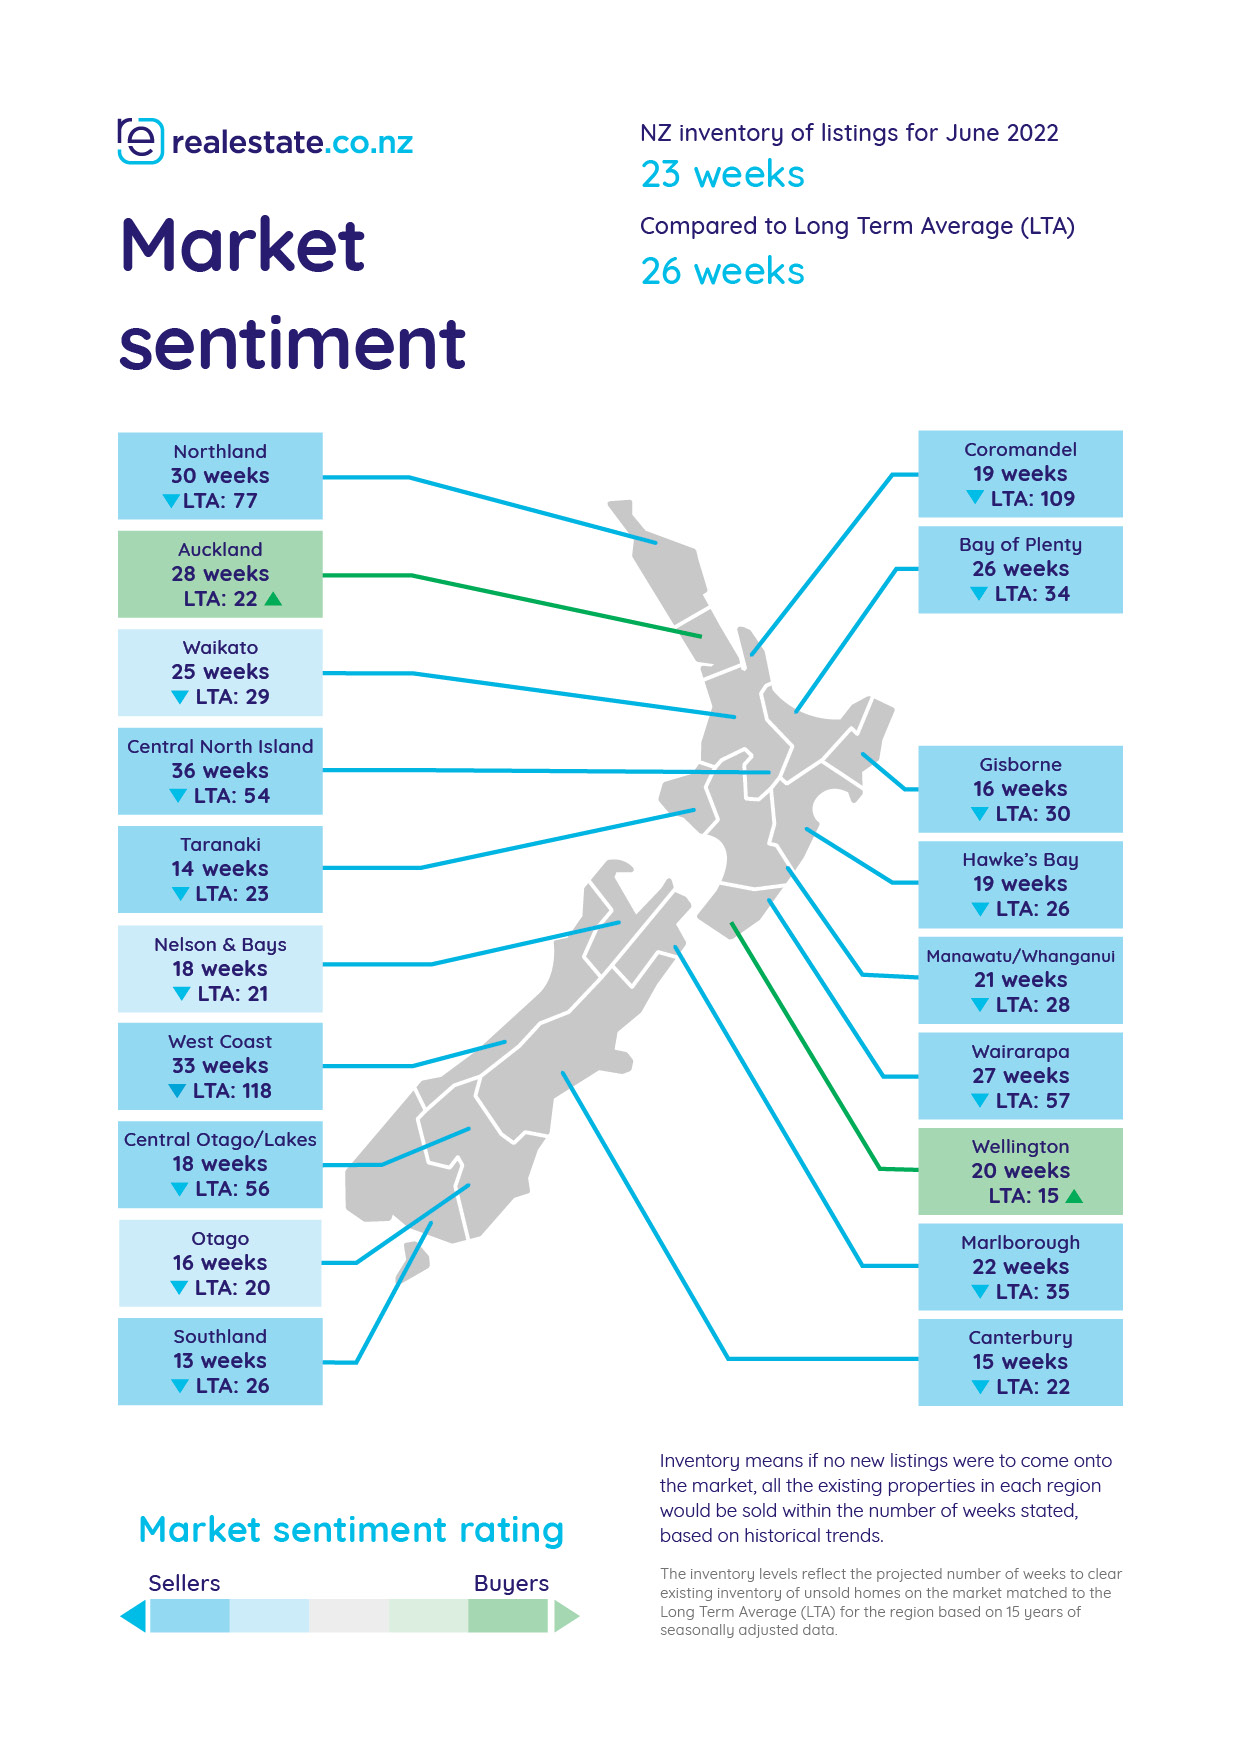
She adds that buyers’ markets in Auckland and Wellington for the third and fourth month in a row is something the market hasn’t seen this consistently since 2014.
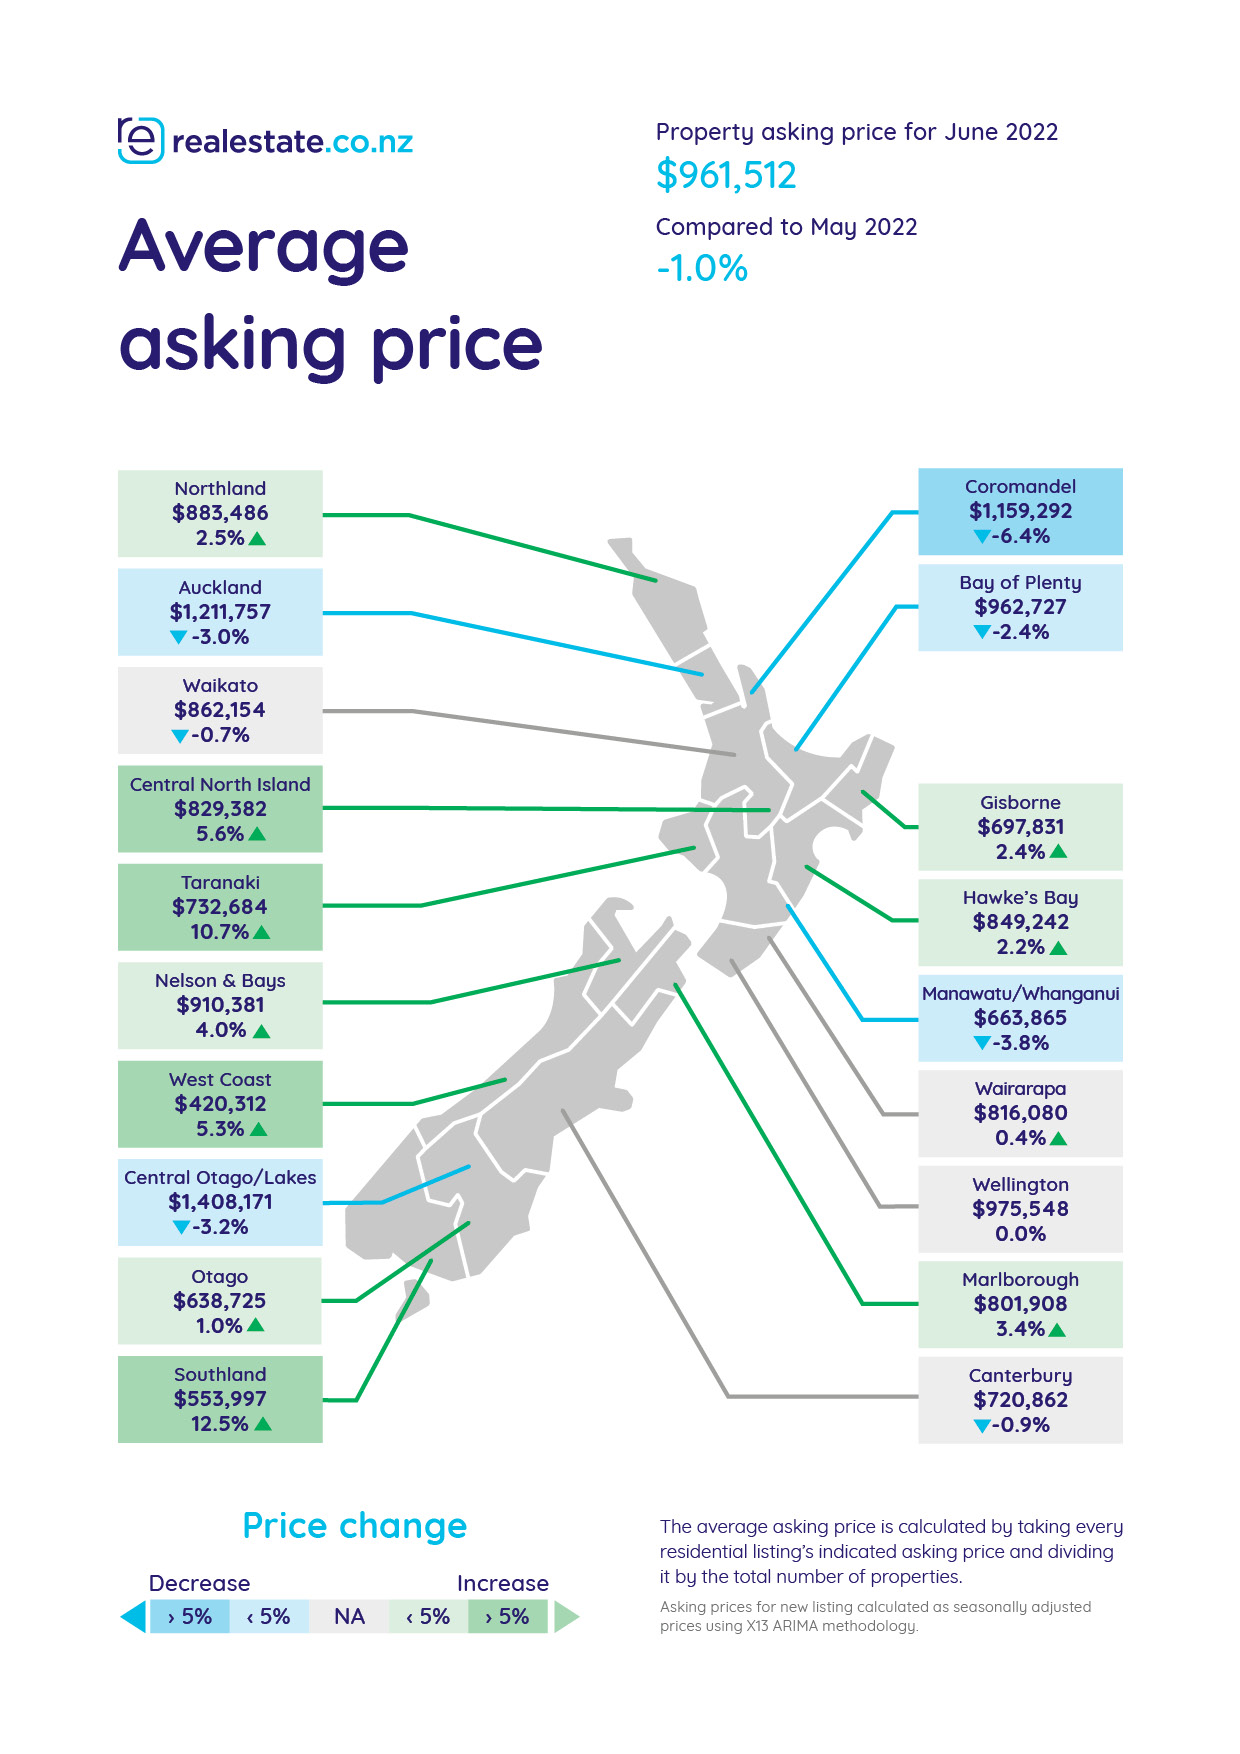
Average asking prices are stable in most regions, but there are no signs of the "bubble bursting".
Compared to May 2022, average asking prices held stable last month with fluctuations of no more than around 5% in most regions. The exceptions were in Taranaki and Southland, where prices hit 15-year average asking price highs - increasing by 10.7% to $732,684 and 12.5% to $553,997, respectively.
Growth is still strong year-on-year in most regions. Average asking prices have increased in all regions compared to June 2021, with 14 of 19 regions recording double-digit growth.
Vanessa says the data tells a much more positive story than those speculating a market crash.
“15-years of data doesn’t lie. Long-term, average asking prices have only followed an increasing trend – irrespective of recessions, interest rate fluctuations and even a pandemic,” says Vanessa.
She says that while short-term fluctuations are inevitable, it’s important to look long-term when it comes to property to avoid making short-sighted decisions.
“In June 2007, the national average asking price was $419,317. It’s now more than double that at $961,512,” says Vanessa.
Auckland and Wellington in buyers’ markets - still.
Auckland and Wellington remained in buyers’ markets for the third and fourth consecutive months signalling that the slow-down in the rate of sales in these regions might be here to stay.
Market sentiment data from realestate.co.nz showed the gap between the current rate of sale and the long-term average also starting to close nationally and in Waikato, Nelson and Bays, and Otago last month. Vanessa says, although these regions are not in buyers’ markets yet, they are showing signs of tipping.
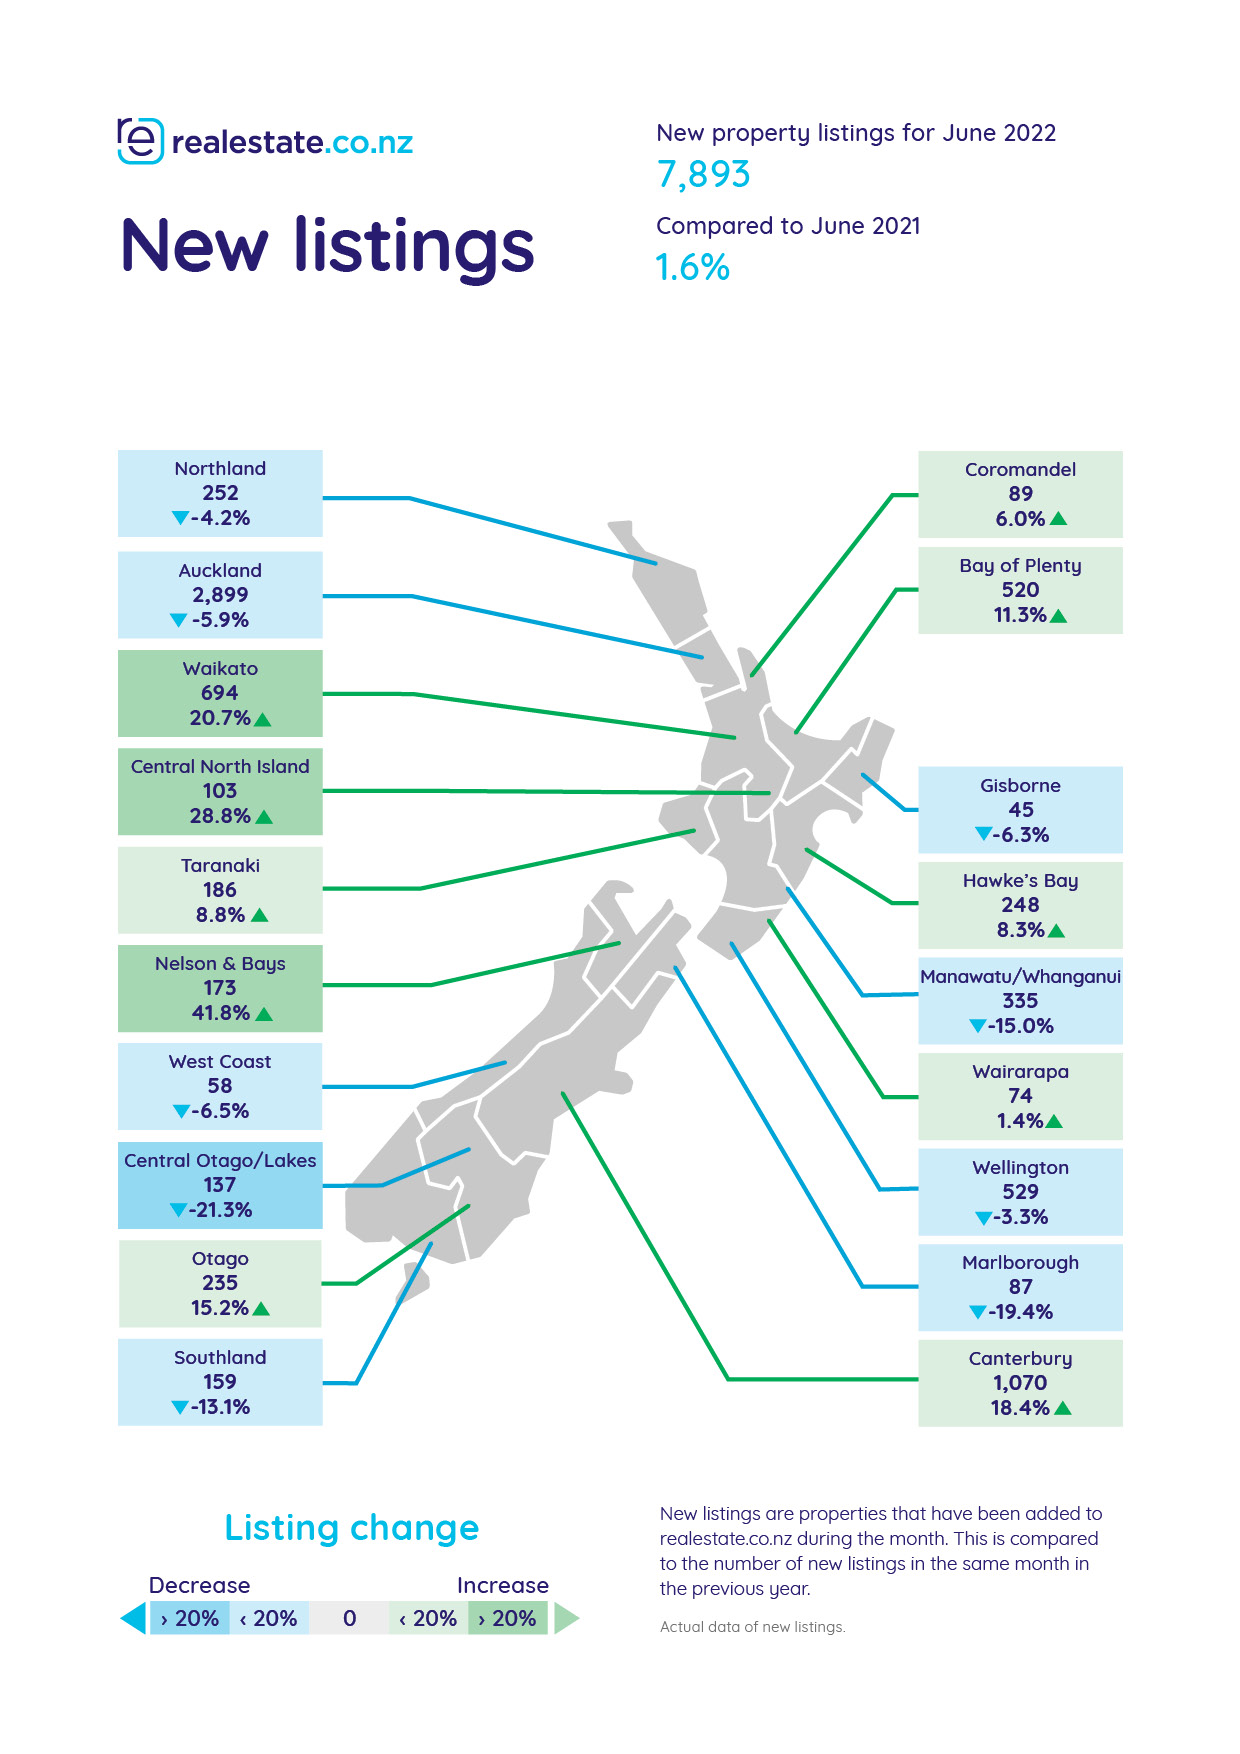
“Interestingly, there is a correlation between a strong number of new listings coming onto the market and the regions where market sentiment is changing. It seems that active vendors putting their homes up for sale are making the market favourable for buyers,” says Vanessa.
New listings were up year-on-year by 1.6% nationally (7,893) and by 20.7% in Waikato (694), 41.8% in Nelson and Bays (173), and 15.2% in Otago (235).
Buyer’s choice: national stock almost doubled compared to last year
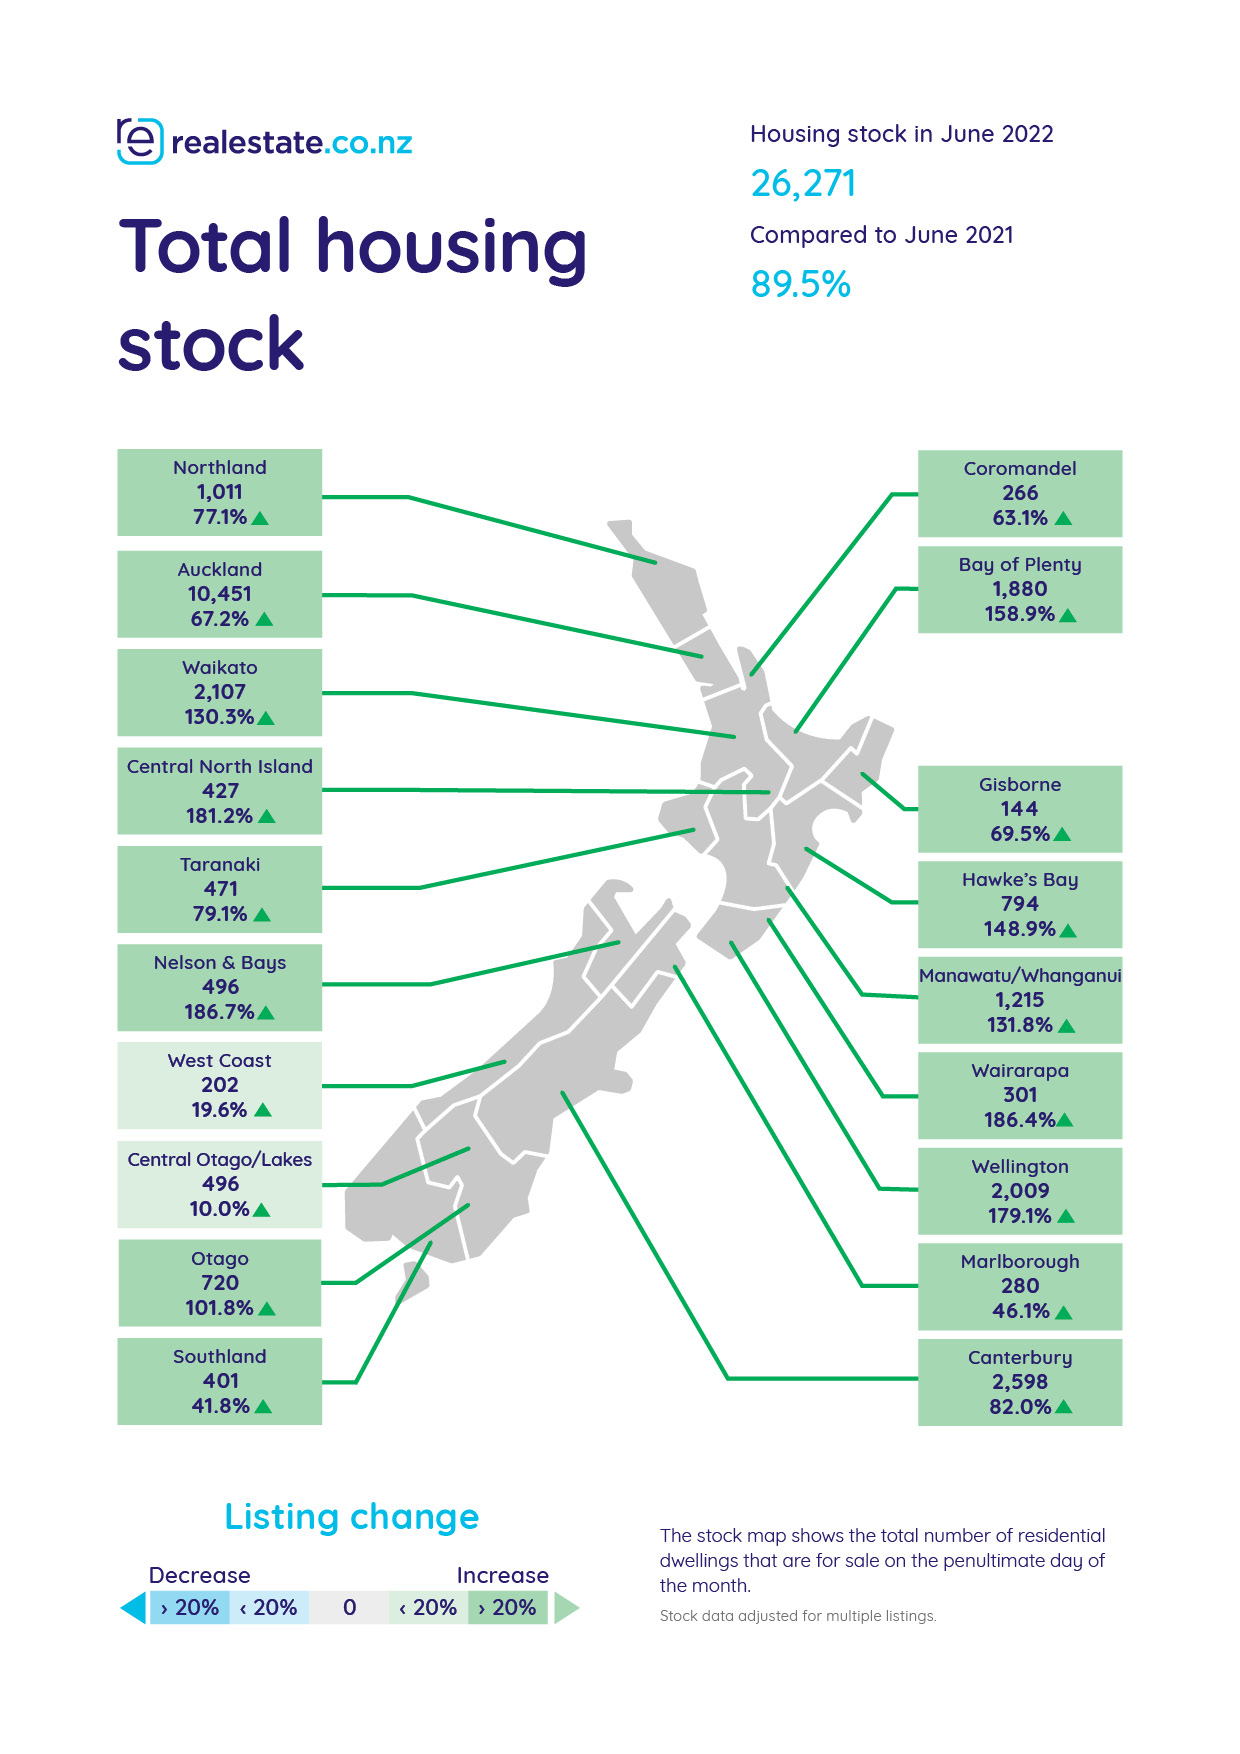
Housing stock was up 89.5% nationally compared to June 2021. All regions also saw double or triple-digit growth compared to the previous year, signalling that property seekers had plenty of choice last month.
The biggest year-on-year increases to stock were in Nelson and Bays (up 186.7% to 496 total homes), Wairarapa (up 186.4% to 301 total homes), Central North Island (up 181.2% to 427 total homes) and Wellington (up 179.1% to 2009 total homes).
Vanessa says the stock numbers are in stark contrast to what they were a year ago:
“With stock almost tripling in some regions, this is a good time for property seekers. More choice increases a buyer’s chance of finding the perfect property, and we hear from agents that buyers have more breathing room to peruse in the current market.”
Vanessa says that property is a significant purchase so having more time for due diligence is positive for buyers.
For media enquiries, please contact:
Ashley Harder | 021 712 210 | ashley@realestate.co.nz
About realestate.co.nz
As the longest-standing provider of real estate data in real-time, realestate.co.nz offers valuable property market information not available from other sources to make it easier for New Zealanders to buy and sell property. With residential, lifestyle, rural and commercial property listings available, realestate.co.nz is the place where serious buyers look for property.
Glossary of terms:
Average asking price (AAP) is neither a valuation nor the sale price. It is an indication of current market sentiment. Statistically, asking prices tend to correlate closely with the sales prices recorded in future months when those properties are sold. As it looks at different data, average asking prices may differ from recorded sales data released at the same time.
New listings are a record of all the new residential dwellings listed for sale on realestate.co.nz for the relevant calendar month. As the site reflects 97% of all properties listed through licensed real estate agents in New Zealand, this gives a representative view of the New Zealand property market.
Stock is the total number of residential dwellings that are for sale on realestate.co.nz on the penultimate day of the month.
Inventory is a measure of how long it would take, theoretically, to sell the current stock at current average rates of sale if no new properties were to be listed for sale. It provides a measure of the rate of turnover in the market.
Seasonal adjustment is a method realestate.co.nz uses to better represent the core underlying trend of the property market in New Zealand. This is done using methodology from the New Zealand Institute of Economic Research.
Truncated mean is the method realestate.co.nz uses to supply statistically relevant asking prices. The top and bottom 10% of listings in each area are removed before the average is calculated, to prevent exceptional listings from providing false impressions.


01 Jul 2022

